
NQ is still someway short of the double bottom target at 4815, but ES has now come (twice) within three ticks of the target full retest of the all time high, and should make that target shortly. ES Dec 60min chart:

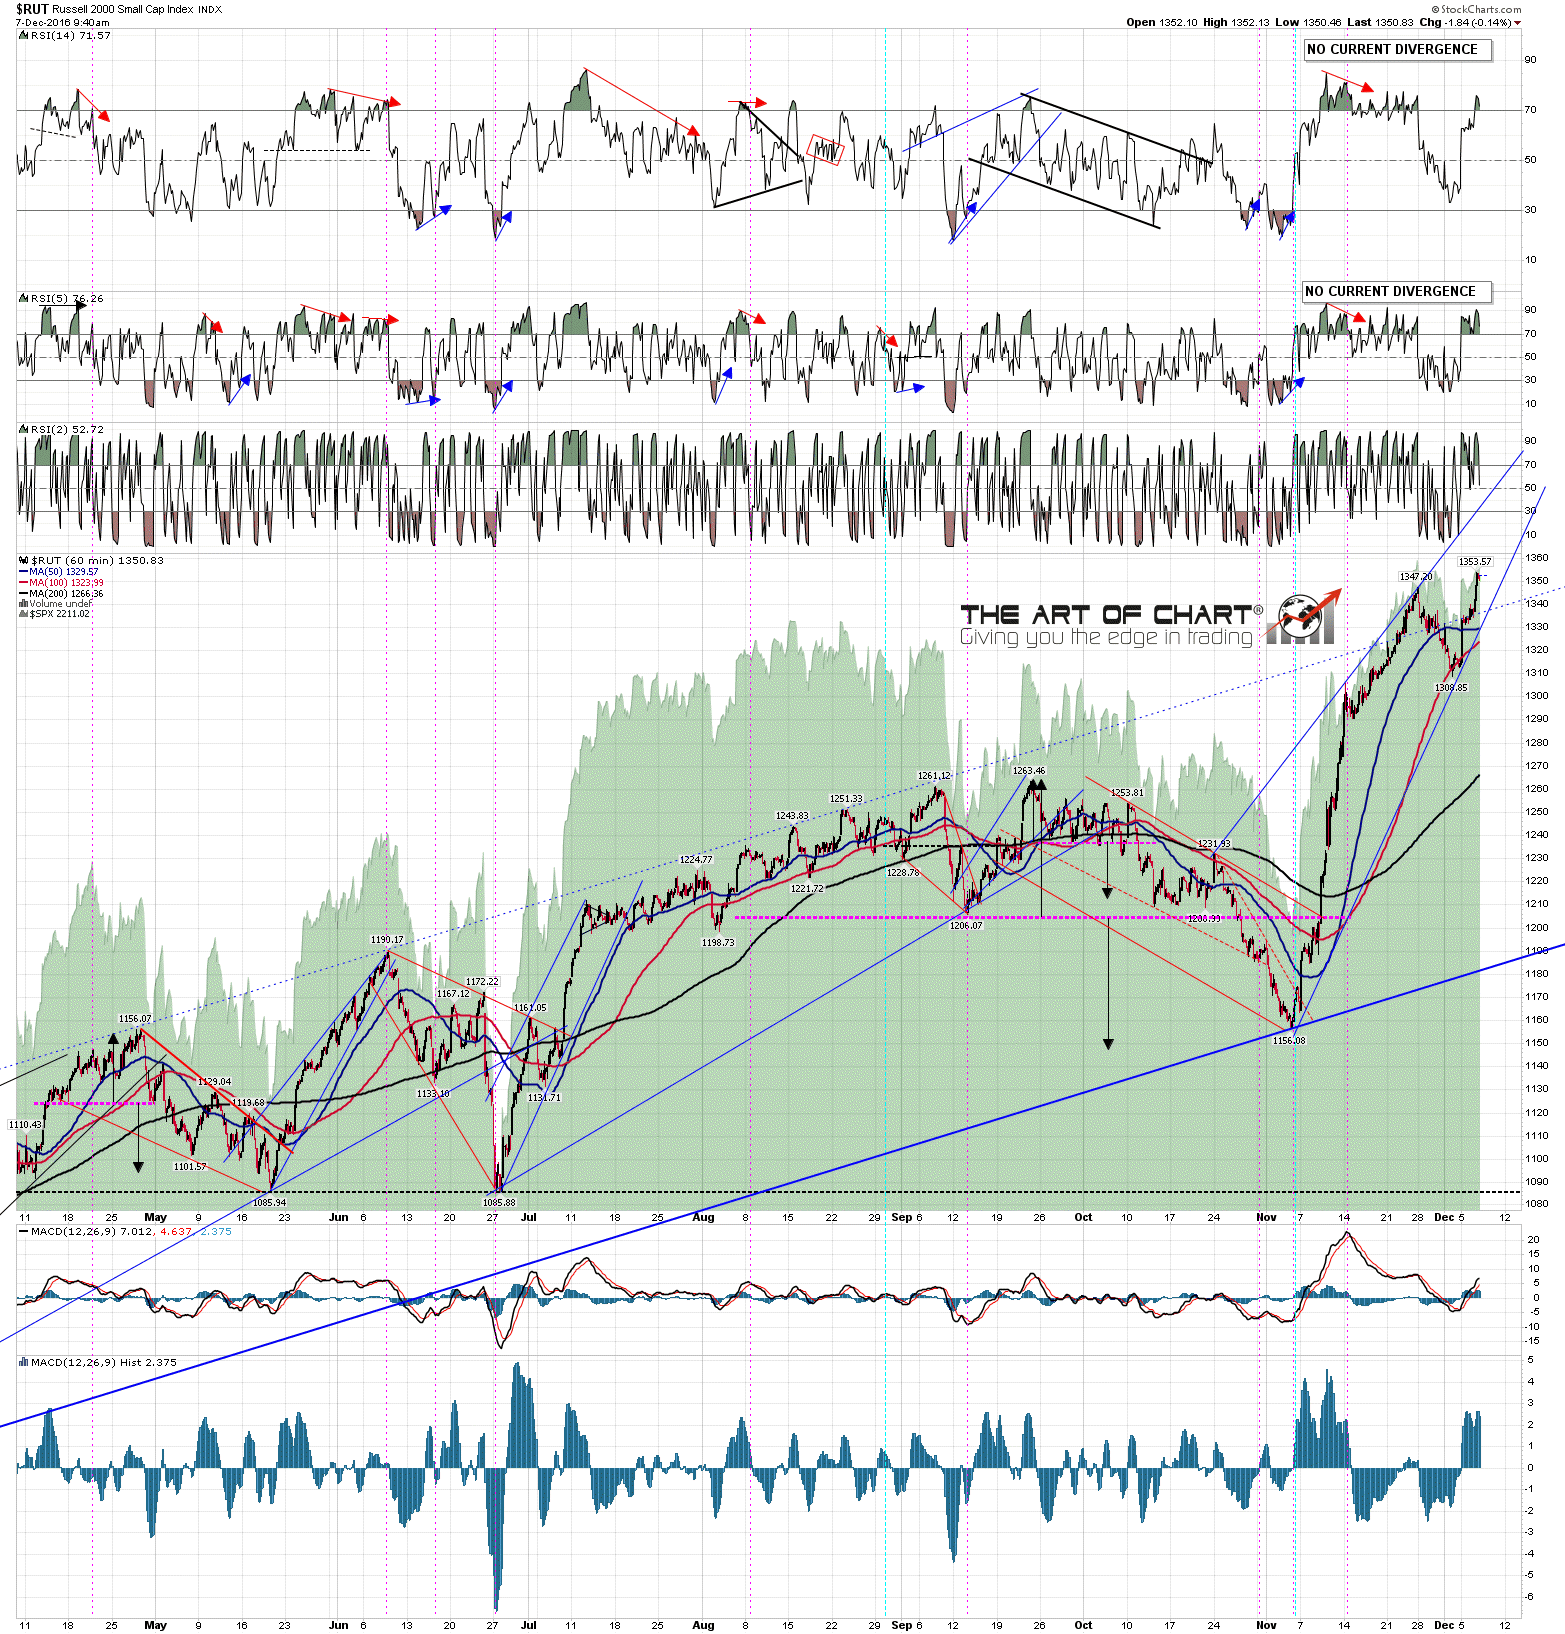
So when might we see some resistance? Possibly at that ATH retest on ES/SPX of course, but if not I have a possible rising wedge forming on RUT that looks interesting. Wedge resistance currently in the 1370-5 area, but a moving target obviously. RUT 60min chart:
We’re leaning bullish for much of the rest of the month, but that doesn’t mean that we are expecting a big impulse up here. I’m thinking more along the lines of a two way market with an upward bias. We’ll see how that goes.
