
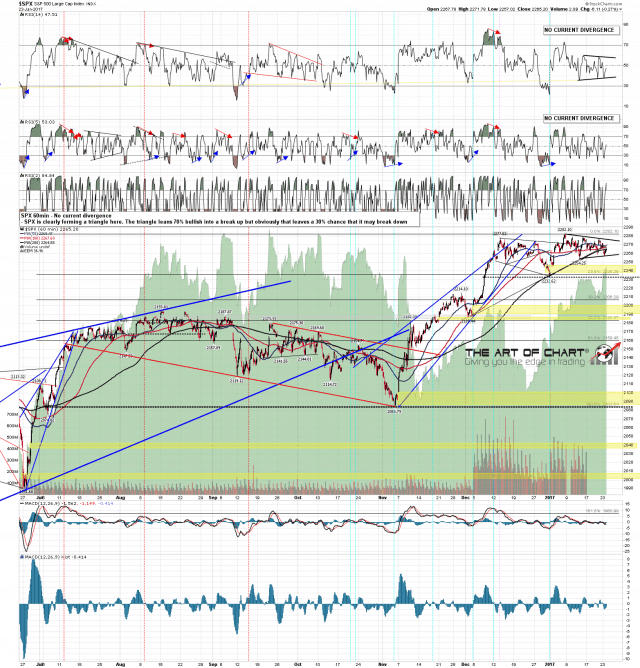
SPX retraced a little deeper than I expected yesterday and I’ve adjusted the support trendline but on the RSI 14 the low was exactly at triangle support and this is a decent looking triangle. The next target within the triangle would be to triangle resistance, currently in the 2276 area. Stan’s looking for a very possible break up there. SPX 60min chart:
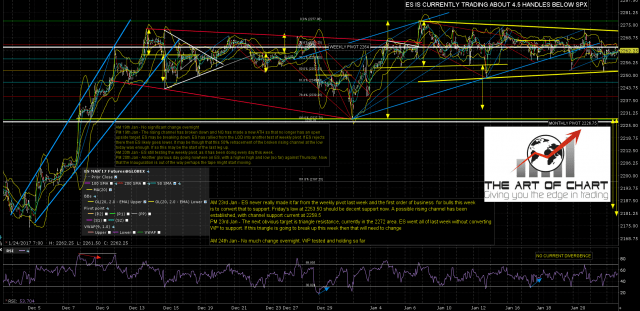
On ES triangle resistance is now at 2272. The weekly pivot at 2264 is an important level that needs to be converted to support to reach triangle resistance. ES Mar 60min chart:
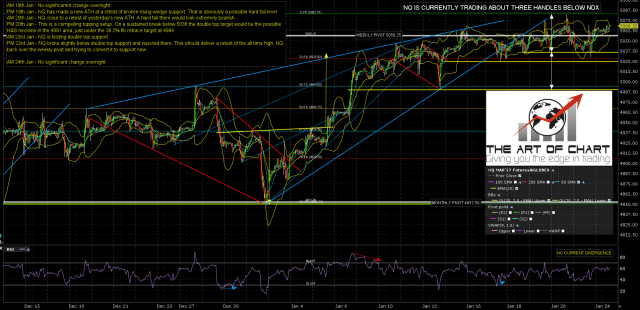
The double top on NQ broke down slightly and failed last night with a clear target back at a retest of the ATH, and NQ is close to that retest now. NQ Mar 60min chart:
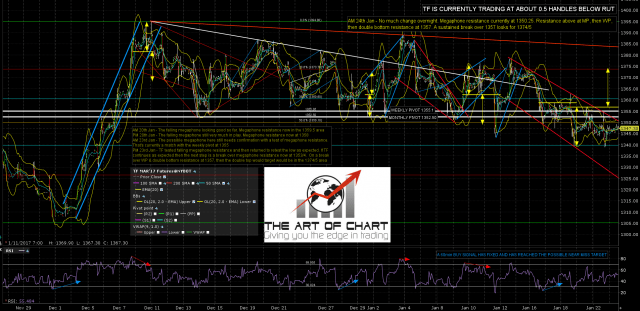
TF declined into the second low of the double bottom that I was looking for yesterday morning and is now testing double bottom resistance at 1357. A sustained break above looks for 1374/5. The falling megaphone on the chart broke up at the open today. TF Mar 60min chart:
I don’t think I posted one of my premarket videos last week so here is the link to this morning’s video, which also covers the futures for USD (DX), oil (CL), gas (NG), gold (GC) and 30yr treasuries (ZB). I do these before the open every day for subscribers to the Daily Video Service at theartofchart.net. As part of the service Stan also does a video after the close and updates are posted on the private twitter feed before the open and during the day. If you’re interested in trying the service you can try a free trial on this page here.
Stan and I are doing a free educational webinar at theartofchart.net an hour after the close on Thursday on the subject of ‘Technical Patterns you can profit from’. If you’d like to attend you can register for that on this page here.
