Slope of Hope Blog Posts

Slope initially began as a blog, so this is where most of the website’s content resides. Here we have tens of thousands of posts dating back over a decade. These are listed in reverse chronological order. Click on any category icon below to see posts tagged with that particular subject, or click on a word in the category cloud on the right side of the screen for more specific choices.

A Strong Breadth Market

By -

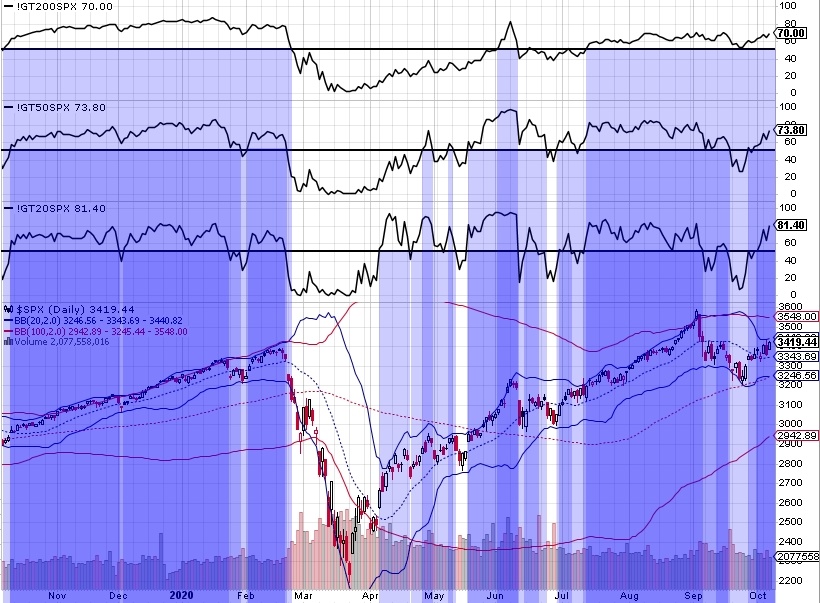
While doing my end of week market reviews over the weekend, I noticed that the close Friday, Nov 13th had extremely strong Moving Average Breadth, that is, high percentages of stocks above 20, 50, and 200 moving averages. This got me very curious so I went back to 1999 (as far back as %200MA numbers go) to compare similar market conditions.

I set the criteria at an extreme level of >85% intentionally to ferret out how common this was. Truth is, it is a very rare condition for all three to be true. I felt the study would be more helpful if I expanded my markups to slightly relaxed conditions. Met criteria are in blue, expanded criteria are in gray.

(more…)

GEX Says Beware

By -

The Gamma Exposure Index (GEX) has made some seriously large negative divergences coming into the recent highs. In a simple sense, this shows that net option positioning has turned more and more negative the higher the S&P500 has become. It looks remarkably similar to March. Are we in for a repeat?

GEX gamma negdiv

If you would like to read more about the GEX, I have attached the white paper below.

GEX ATH GTFO

By -

Today (Oct 13th), the GEX had its highest reading EVER. I’d like to play with the data and see if I can adjust it for volatility because it seems that the moves have become more and more wild over the past couple of years (ever since Volmageddon). Anyways, back to the topic at hand. Here is today’s reading (click for the zoom in, it’s HUGE). Also, note what usually takes place within a month or so afterwards on SPX (green).

GEX all
(more…)

Gold Has Something to Prove

By -

Gold had a significant up day on Friday closing near the highs. At first glance, it would seem like a positive development and that gold miners might be in for another leg up. I would say a case could be made for either outcome, but this week should be a decision week for what is next for the gold and miners.

This is gold going back 20years. It is a weekly chart with a 52-week bollinger band. Notice how well price holds the 52-week MA during gold bull markets suggesting it is still in one. However….

Gold yrs
(more…)

All Aboard?

By -

The one thing I especially like about Index trading is that it’s easier in my opinion to determine the likely direction because you can get a direct reading of all of its constituents. I’m going to share a chart that I’ve been using for some time now that gives me a general idea of the likely strength or weakness of the S&P500. It is the breadth readings for “Percentage of Stocks Above X simple moving averages“.

GT
(more…)