Slope of Hope Blog Posts

Slope initially began as a blog, so this is where most of the website’s content resides. Here we have tens of thousands of posts dating back over a decade. These are listed in reverse chronological order. Click on any category icon below to see posts tagged with that particular subject, or click on a word in the category cloud on the right side of the screen for more specific choices.

Gamma Gamma Bo-Bamma…

By -

Over the weekend, I introduced Slope to some DIX pics. Now I would like to introduce you to the GEX which is short for “gamma exposure”. Basically, it’s the numerical sum of all the long gamma minus all the short gamma on S&P500 options (not SPY).

If you’re not familiar with gamma, here is the official definition:

Gamma is the rate of change for an option’s delta based on a single-point move in the delta’s price. Gamma is at its highest when an option is at the money and is at its lowest when it is further away from the money.”

According to their whitepaper they calculate it as follows:

(more…)

Big Swinging DIX

By -

I don’t hear many people talk about the Dark Pools Index, but here is a quick introduction. If I am understanding it fully, and that is a big IF, it is an attempt by a market researcher (who can be found on twitter under the handle @Squeezemetrics) to hazard a guess at the buying and selling demand being processed by market makers. I’m sure I cannot explain it fully and you would be better off reading the white paper at squeezemetrics.com. It is a quick five minute read and very interesting. All data is freely downloadable to play with as you please.

Generally speaking, when the DIX (Dark Pool Index) moves to the upper extremes, dark pool buying is a primary influence. When the DIX moves to the lower extremes, dark pool selling is the the primary influence. See for yourself.

(more…)

FAANG(ks) Giving Rally Incoming?

By -

I was taking a close look at FAANG this week.  It was interesting that every single one is on some kind of intermediate support.  As much as I would like to bring a bearish prize to the slopeofhope ready for a mauling, I think this lends evidence to the argument that the S&P500 is in for a months long rally. Back in September, XLK, the tech ETF SPDR was in a large rising wedge. Rising wedges break down into channels. Look where we are now.  (click any picture for a larger version)

XLK weekly (more…)

Volatility Ratio Follow Up: How Many Days to a Retracement High?

By -

I think it’s only natural after a decline like Oct 10-11, 2018 for people to ask themselves a variety of questions.  “Is the bottom in or not?”  “Should I buy now or is it going to roll over again?” and “If it is going to roll over, how far does price bounce before rolling over?”

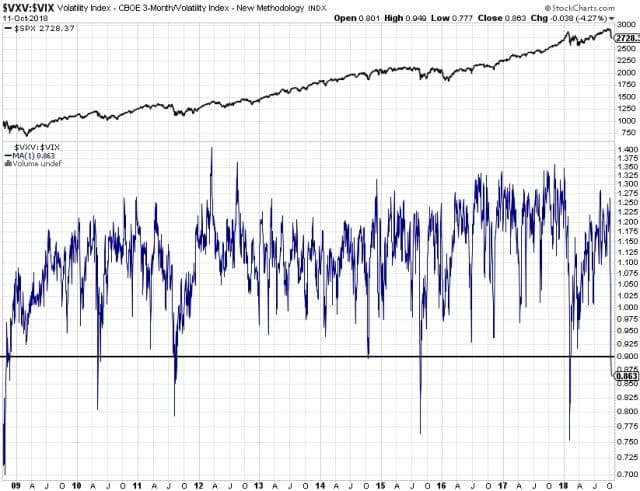
The question I’m asking today is, “After a decline that coincides with a $VXV:$VIX ratio under .90, how long does it take for a retracement to be put in and price to start rolling over?”

Based on the conclusions of my previous post, the likelihood of another test of the lows in approximately two months time appears to be high, even after a retested low has been put established.  On the path to two months from now, however, we still have to navigate a market day to day.  The paths after the ratio low signal triggered varied so much, it’s hard to really come up with anything consistent and even if there was a pretty clear repeated path, I wouldn’t want to suggest that there weren’t other paths that price could take, even a path that’s never been taken before because anything can happen.  In most cases, the final peak before a decline to at least the first low if not a lower low (or bear trap) took 4-6 weeks to be reached.  In the near-term, however, they all had an initial peak relatively quickly which provided a boundary for a chop zone (trading in a range).  This is what I want to explore. (more…)

Front Month vs 3-Month Volatility Study

By -

Hey Gang, no trade suggestion this time.  I’m always keeping an eye out for context of the market environment and looking through some charts tonight, it prompted me to do a little study for myself and I thought I would share it with you all.  Here is the ratio of 3-month volatility to front month volatility.  Today, the ratio closed at .863.  Using a cut off line of crossing below .90, this has only happened seven other times during this entire bull market.  I’m ignoring the bear market bottom on this chart for the moment to keep things in context of the market type.  It’s too hard to really get a good sense of the daily price activity in this chart so I’m going to zoom in to each instance.

VXV VIX yrs (more…)