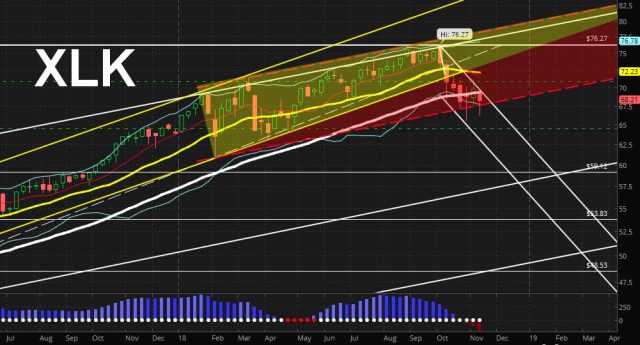
I was taking a close look at FAANG this week. It was interesting that every single one is on some kind of intermediate support. As much as I would like to bring a bearish prize to the slopeofhope ready for a mauling, I think this lends evidence to the argument that the S&P500 is in for a months long rally. Back in September, XLK, the tech ETF SPDR was in a large rising wedge. Rising wedges break down into channels. Look where we are now. (click any picture for a larger version)
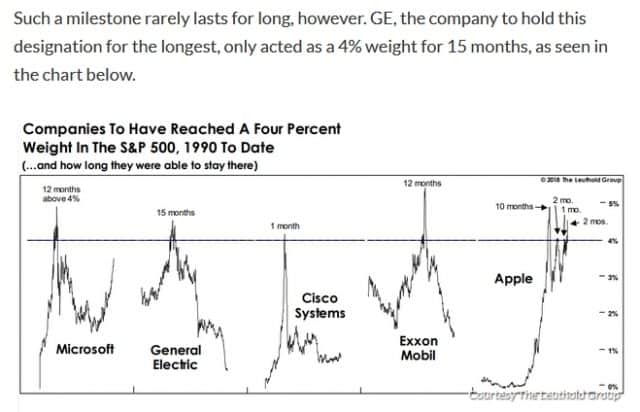
I was looking around for the weightings of FAANG on the $SPX and here’s a quote from this article from marketwatch.
“Jason Pride, the chief investment officer for private clients at Glenmede, recently noted that the five largest companies in the S&P 500 together account for about 16% of the overall index in terms of market capitalization. Such a large combined weighting, he wrote, tends to presage a lengthy period of underperformance. Historically, when [combined market cap] eclipses 14%, those top 5 companies underperform the broader index by -5.5% per year for the next 3 years, on average,” he wrote in a research report.
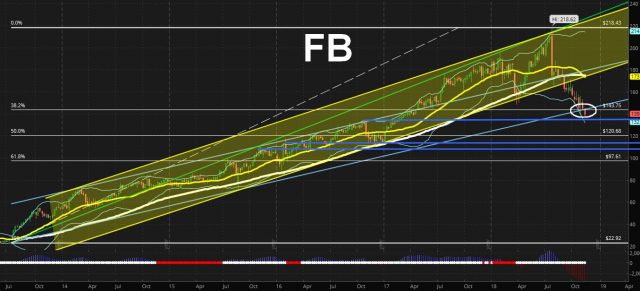
Now for a quick look at the charts (weeklies). FB has been getting pummeled over the past four months and is the weakest of the bunch. It broke its channel back in September and its weekly Bollingers are as wide as they have ever been (and then some). I have no bullish case for this one. It’s broken its lowest possible trendline and all it has now is fibs and price support (blue horizontal lines) below.
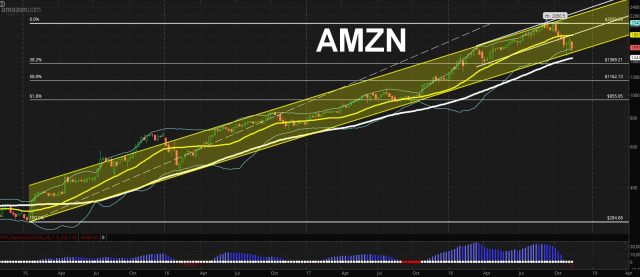
AMZN has reached channel support, tested it twice and held. It’s also tested its weekly BB low three times and held. Looks like the downside is limited on this one.
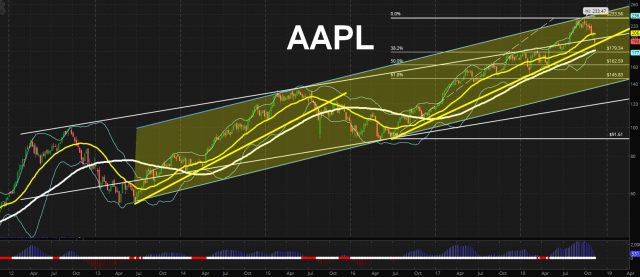
AAPL has held its uptrend line from its 2016 low. It has a fair bit of room above, but being at the top of its larger channel, the upside looks limited and I expect a nice short setup next year sometime.
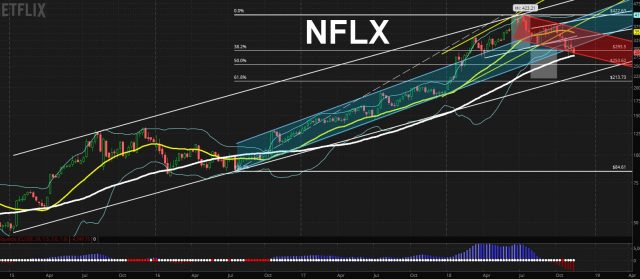
NFLX is one member to look particularly bearish. It formed a giant head & shoulders in 2018 which has broken down breaking its uptrend from the 2016 low and has formed a new channel (red) which has held support. If the market trend is about to change into the EOY, maybe NFLX will make us a nice bear flag here to get short.
GOOGL has formed a long rising wedge since 2015. Rising wedges break down into channels which would suggest that GOOGL has a date with about $850 over the next year sometime. At the moment, however, it’s sitting on the $1000 support level. It has also held its weekly BB low (inset) four times which seems to suggest that the downside is limited for now. If it rallies from here, it could form a head & shoulders pattern. 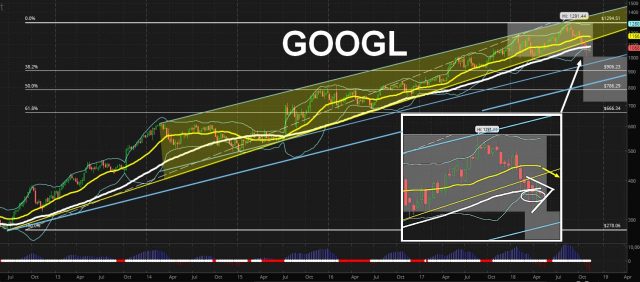
I’ll continue to watch these closely given their large push power on the broad index. Good luck out there and have a great weekend.

