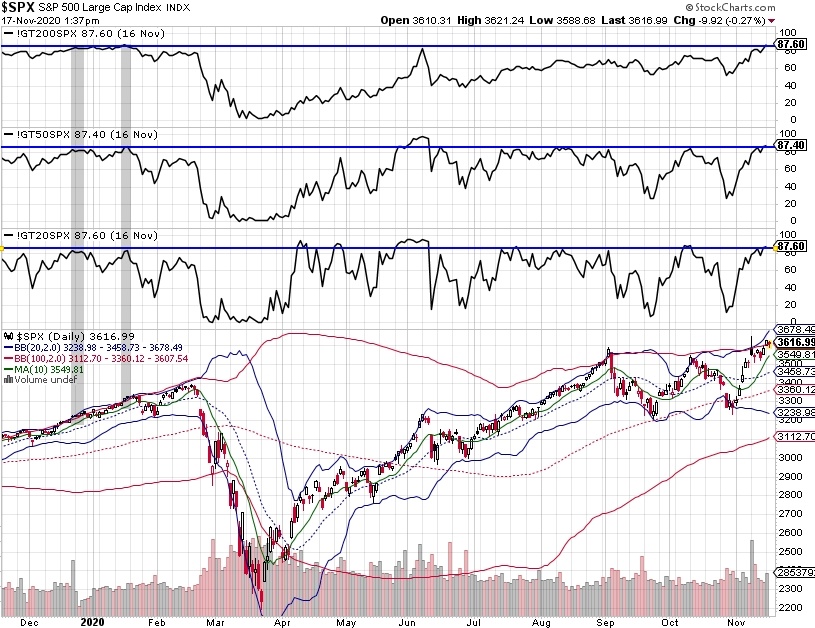
While doing my end of week market reviews over the weekend, I noticed that the close Friday, Nov 13th had extremely strong Moving Average Breadth, that is, high percentages of stocks above 20, 50, and 200 moving averages. This got me very curious so I went back to 1999 (as far back as %200MA numbers go) to compare similar market conditions.
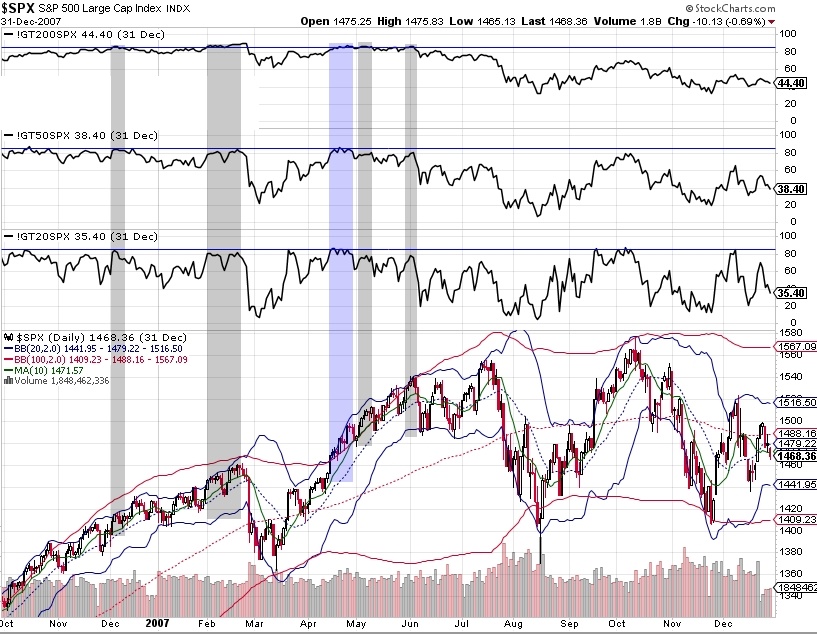
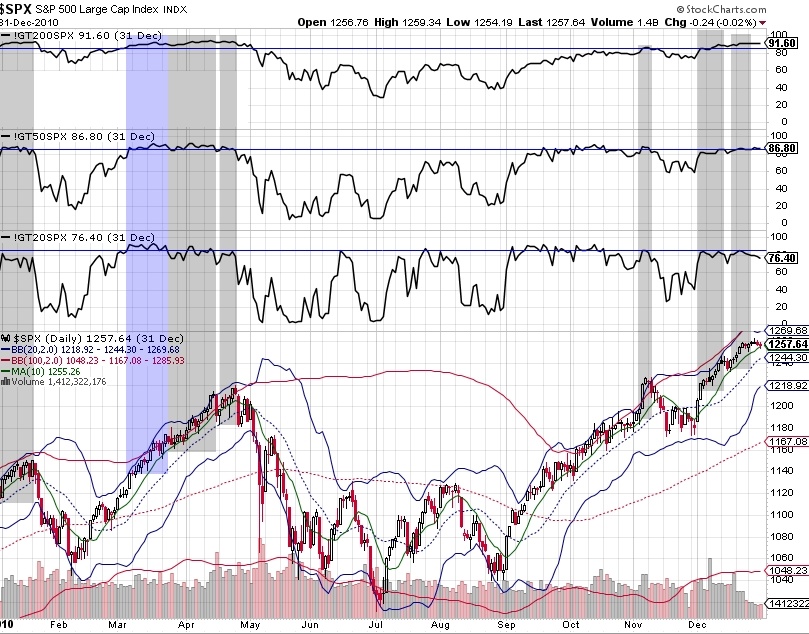
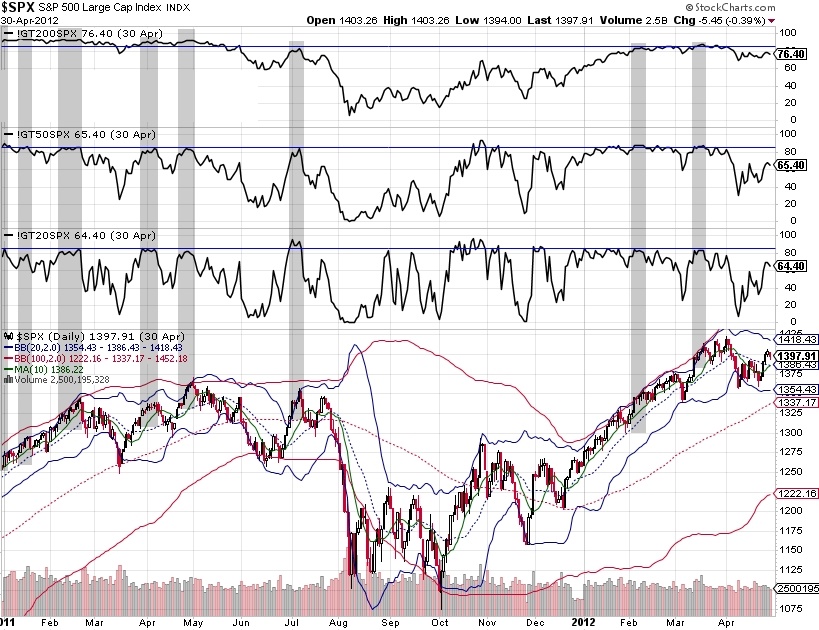
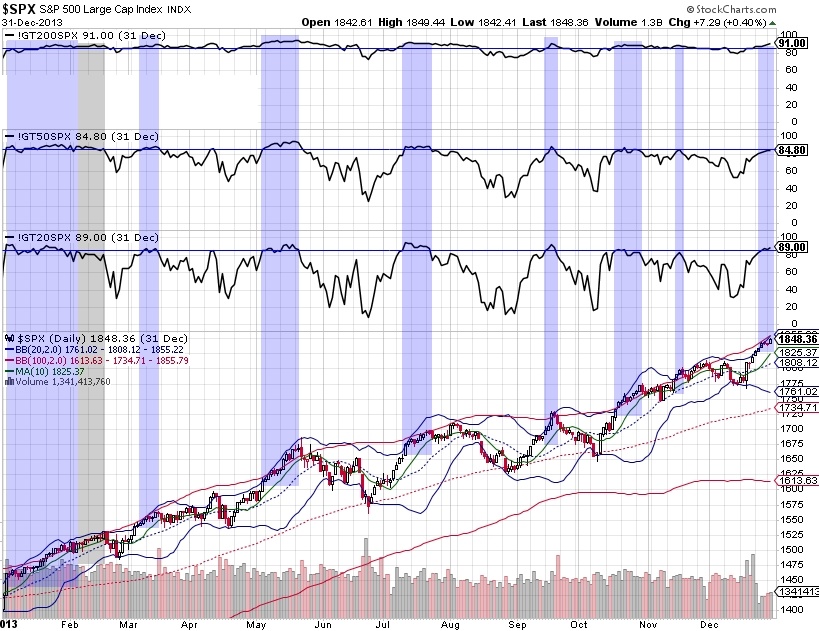
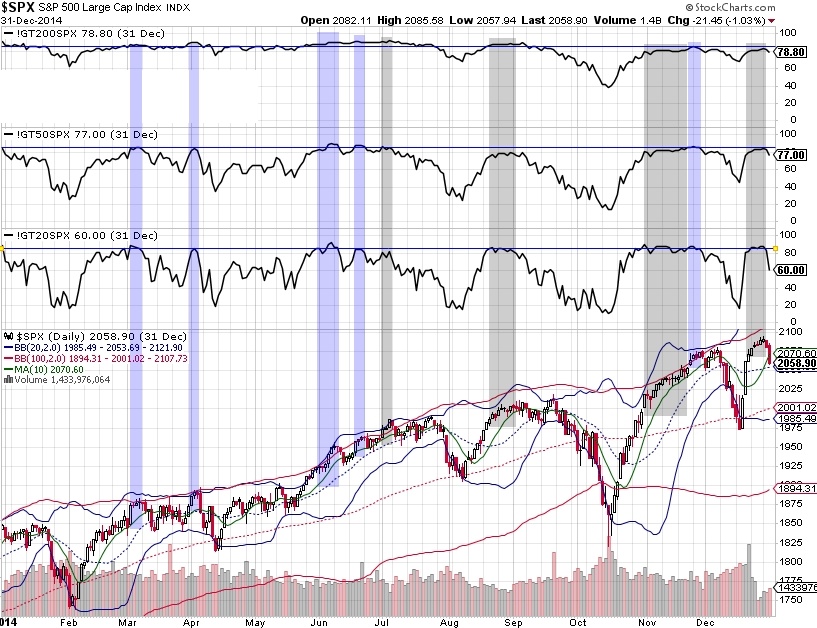
I set the criteria at an extreme level of >85% intentionally to ferret out how common this was. Truth is, it is a very rare condition for all three to be true. I felt the study would be more helpful if I expanded my markups to slightly relaxed conditions. Met criteria are in blue, expanded criteria are in gray.
My observations are:
- It seems to be a common enough market condition when price is grinding the upper weekly Bollinger Band.
- Price tends to follow a stairstep sort of pattern, generally advancing a few days and then pulling back in a day or two and then repeating the pattern though at times strong bursts or extended bursts upwards did occur.
- After extended runs 1-2mos, price was prone to pullbacks to the 100MA or lower.
- I didn’t include it in the charts, but extremely low Equity put/call ratios had a way of ending markets like this. We’re not far from an extreme low in Equity PCR at the moment.
Pictures are worth a thousand words as they say so I’ll leave it to you to draw your own conclusions, but if you don’t mind, add your own observations in the comments. Years where there were no such signals are excluded.