Perspective is everything, and we gain perspective by comparing one
thing to another. I wanted to build some sector and market perspective
for you. How? By providing you with the following:
- time series of when different sectors peaked1
- current retracement to peak in absolute terms1
- percentage decline from peak to trough
- percentage of points
lost retraced - percentage retracement to trough
1
contained in Table 1 below
Table
1
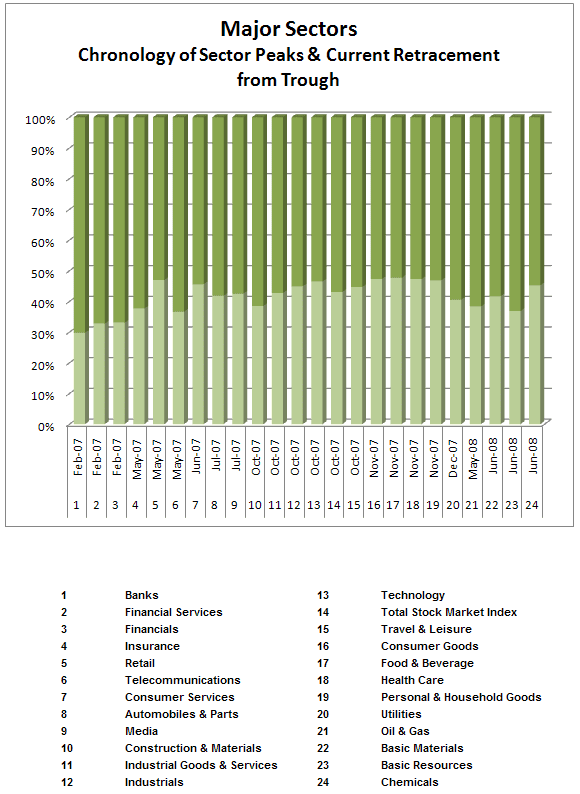
There are a couple of things that are notable from this chart
- It has been more
than three years since the financial sector topped - There was 16
months from the topping of the first sector (Financials) to the last
sector (Commodities)
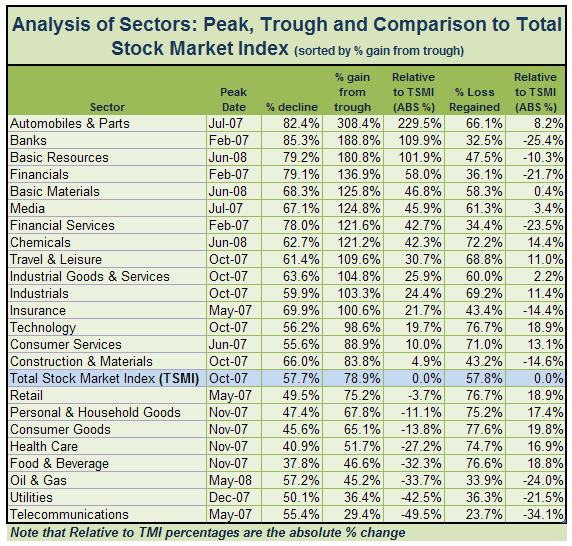
The next table, Analysis of Sectors: Peak, Trough and
Comparison to Total Stock Market Index (sorted by % gain from trough),
will give you view of the sectors that have recovered the most since
their trough:
Table 2
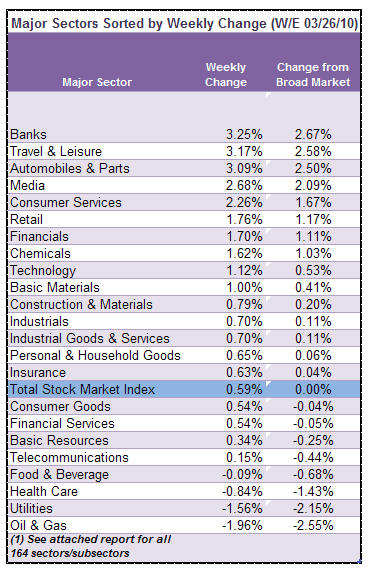
Now
that I've provided you with that, we'll return to our previously
schedule program. Below are the 24 Summary Sectors. You can find the
complete report on the 164 DJUS Sectors in addition to weekly + daily
chart books for the sectors below here.
I hope that you found this
expanded report helpful to providing to you some perspective on relative
time and price performance among the 24 sectors that I highlight for
you each week. You can also see the disparate nature of BOTH time and
price performance through a major cyclical decline and recovery. While
this information is unlikely to make interesting cocktail conversation,
it is a useful mosaic of information to inform your investing/trading
thinking.
I will post periodic updates to the peak/trough tables.
All
data courtesy of Stockcharts.com | Compilation and analysis courtesy of
me.