Slope of Hope Blog Posts

Slope initially began as a blog, so this is where most of the website’s content resides. Here we have tens of thousands of posts dating back over a decade. These are listed in reverse chronological order. Click on any category icon below to see posts tagged with that particular subject, or click on a word in the category cloud on the right side of the screen for more specific choices.

ES Quant Analysis

By -

The ESZ15 market closed another week up last week, this is the 4th week up in a row. By historical statistical means, it is not very common to see 4 or 5 weeks up in a row (or more). To give you and idea the most common pattern is one-two weeks up, followed by 1-2 weeks down. Obviously this does not happens ALL the times, but it does happen quite often.

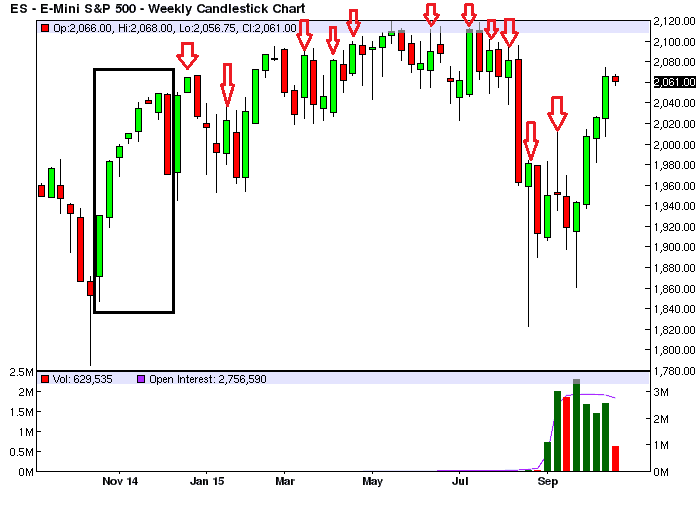
Let’s have a look at the ES WEEKLY chart below, for the last 2 years, we have put a red arrow on top of each WEEKLY Close that was of this type:

1 Week up, then reversal next week (negative weekly Close/s).

2 weeks up, then reversal next week (negative weekly Close/s).

index3 (more…)

Historical & Statistical Yearly Perspective

By -

(Editor’s Note: below is a post that Retracement Levels submitted. For reasons that will become clear as you read it, I’d take issue with some of the points made, but I frankly think there is plenty enough room here for divergent opinions. I appreciate the post. – Tim)

Since the first time, I have been on this blog, in 2006, (at the time it was hosted on blogger), I have always been mesmerized by the observation of the desperate attempts that all the various market analysts, gurus and forum posters made at predicting long term trends in Bull and Bear Markets.

Most people seem to be convinced that if you analyze a very large amount of information, including all sort of possible market predictions (plus your personal bias, never forget that, and some astrology and psychology to sprinkle it all up), they will come up with a verdict about where the market is headed.

It is a truly entertaining show.

(more…)

USO Long (by Retracement Levels)

By -

(Note from Tim: 2sweeties is resuming more frequent posts here on Slope, and this is another. With all humility, and mainly because I’m talking my book here, I disagree with a bullish disposition toward crude oil, but Lord knows I’ve been wrong on occasion before. Here ya go:)

This trade could work as quick trade with a target around ~16, but if after that you want to hold with a Trailing Stop in the hope of a much larger uptrend… you can do that, maybe you are lucky and it works.

To find where to exit our trades, we usually check the opposite model direction, for example if you enter a trade LONG with the LONG model, then you can use the SHORT model to know where to exit and take profit.

Let’s have a look to USO’s DAILY chart:

(more…)