
The ESZ15 market closed another week up last week, this is the 4th week up in a row. By historical statistical means, it is not very common to see 4 or 5 weeks up in a row (or more). To give you and idea the most common pattern is one-two weeks up, followed by 1-2 weeks down. Obviously this does not happens ALL the times, but it does happen quite often.
Let’s have a look at the ES WEEKLY chart below, for the last 2 years, we have put a red arrow on top of each WEEKLY Close that was of this type:
1 Week up, then reversal next week (negative weekly Close/s).
2 weeks up, then reversal next week (negative weekly Close/s).
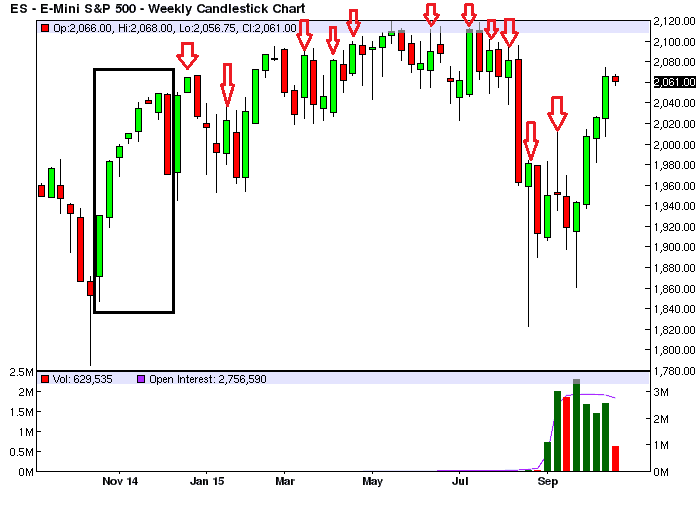 As you can see by yourself NOT ALL reversals (red candles) are greatly successful, but some are and offer fairly decent profits for short-term traders.
We have also highlighted in a square box a case where there were 7 weeks closing up, the following correction was about 100 points, so again here is for all the naysayers that say that a big move up is not followed by a big move down: it depends on, sometimes it is followed by a big reversal, sometimes a medium reversal and sometimes a small reversal, there is no way to predict how large a reversal will be because markets are random (or better we can predict the max size, but not the actual size) – in any case, if you take an informed bet based on statistical data, your chances of success will sharply increase, on average.
Now, before someone thinks he/she can trade by just going short after 1-2 weeks up, think again, it’s not that simple, you need to build an equation for your trades, where position size, risk management, stop loss size, profit size, win/loss ratio estimation, etc., they all play a key role in building a successful strategy and this is why only with the help of statistics you can approximate an estimation of what your returns will be. There is no certainty though, all models are a bet, with some odds of success associated to it, and since we are not dealing with fixed planetary motions but with chaotic and difficult-to-predict price moves, you can only predict up to a certain point.
Now, going back to ES, have a look at the WEEKLY and MONTHLY models below (ignore the DAILY please):

You can see that according to our statistical model, this market has a very overbought situation beginning when the price rises in the 2070-2110 levels area. That means this market is ripe for a WEEKLY/MONTHLY correction. Now put that information together with the number of WEEKLY positive closes (4 so far) and you have a pretty good setup to go SHORT with good odds of success. Does that mean there will be for sure a correction?
Well, yes, but we cannot say exactly if it will be at 2080 or 2090 or other price, or if it will happen this week or after another 3 weeks closing up. We can only say that from where we are now, we are reaching the statistical “limits” of this price move and thus we have somehow near certainty that soon there will be a WEEKLY correction, and maybe also a MONTHLY correction (but we do not know how big they will be, small, medium or large).
Take the bet and let the market give you whatever profit it decides to give to you, you have no power over that, this is not a casino that pays regular payoffs for your bets.
Sophisticated strategies to deal with market chaos are available for advanced FX/Futures/ETFs traders, but there is no room to discuss it here, if you are interested, please contact us for more info:
Click here if you want to gain access to all our quantitative trading models, we cover a number of selected ETFs, FX Spot, Indices and Futures markets (full list).
Click here if you want to receive the E-mini S&P500 Analysis every day in your inbox.
