
(Editor’s Note: below is a post that Retracement Levels submitted. For reasons that will become clear as you read it, I’d take issue with some of the points made, but I frankly think there is plenty enough room here for divergent opinions. I appreciate the post. – Tim)
Since the first time, I have been on this blog, in 2006, (at the time it was hosted on blogger), I have always been mesmerized by the observation of the desperate attempts that all the various market analysts, gurus and forum posters made at predicting long term trends in Bull and Bear Markets.
Most people seem to be convinced that if you analyze a very large amount of information, including all sort of possible market predictions (plus your personal bias, never forget that, and some astrology and psychology to sprinkle it all up), they will come up with a verdict about where the market is headed.
It is a truly entertaining show.
Since their humble beginnings in the 1850s, investment strategies have become increasingly sophisticated and since the early 2000 the Statistical Trading has started to rise and become (as of today) the dominant rationale behind every professional and institutional investment decision.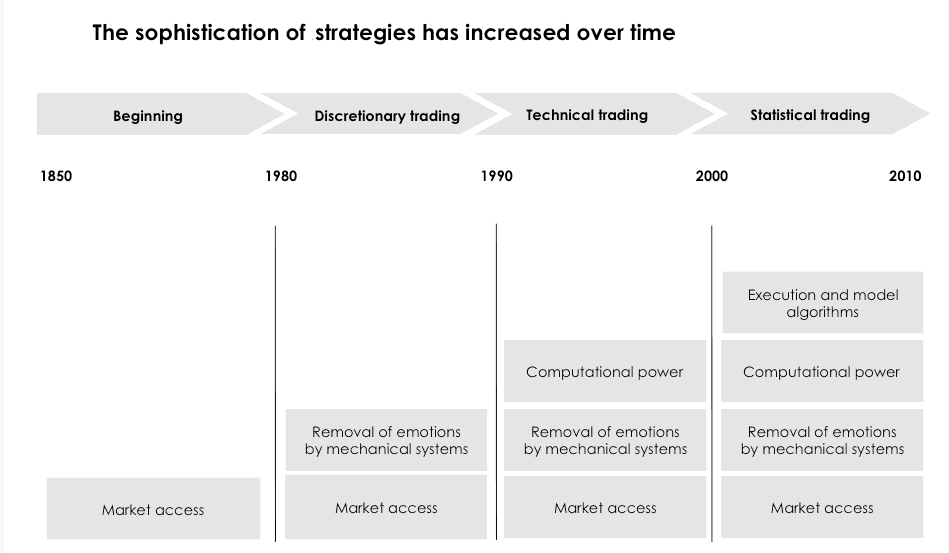
So, I always wondered why today, in the era of powerful computer and data accessible to anyone (check QUANDL, for example), some people remains fixated with making predictions based on things like drawing a trendline on a chart or reading into the latest CPI numbers, or projecting the forecast for the differential interest rate between EUR and USD and so on, I could continue forever as there are so many bits and chunks of information NOISE out there, including CNBC and similar venues that one could make his head spin so fast and mutilate completely his ability to discern what is right and what is wrong. Maybe that is why ALL retail traders are losers and do not make any money, ever.
I am not here to promote anything, please bear with me, I am just trying to make a point: instead of looking at noisy information, or instead of being guided by your personal bias (the market must go down because this is insane, the Fed has distorted everything, my grandma has a pain in her left foot, etc.), wouldn’t it be better to try to look at the market honestly in the form of data?
Because that is what the most modern and successful investors do, but still the small retail/hobby investor is stuck with trendlines, Elliott Waves, Technical Analysis at large, market psychology and God knows what else. I guess the small investor thinks he is much smarter of people that trades billions of dollars (with returns in the order of hundred of millions of dollars). He knows better, of course. The institutional guys have access to THE BEST minds and hardware/software and resources available and use statistical data to decide what to do, and have dumped Technical Analysis and the likes long time ago, but the small retail/hobby investor is much smarter, he still uses Elliott Waves, or the trendlines, or the chart patterns, or the news, and so on.
Since it seems that a lot of people is concerned about the end of the current Bull Market, I propose an idea, a simple analysis of YEARLY market data for the Dow Jones Industrial index, from 1900 to 2014, it’s about 114 years of market data and the longest data set available in history for modern markets (unless you want to go back to the Tulip and/or South Seas Bubble and similar but I am not sure you can find that data so easily).
The chart below was created taking data from QUANDL (it’s free for everybody!) and then plotting it in Excel. I just wanted to see how many years in a row the DJI market closed up or down, during the last 114 years, just to get an idea of what happens when we have a yearly close down (often a Yearly close down happens when there is some Bear Market, because Yearly time periods have usually larger price moves than Daily or 60 minutes, for example).

Let me explain the chart meaning: the bars in the top part of the graph are the years when the DJI closed up (1 bar=1 year up), the bars in the lower part are the years where the DJI closed down. The red arrows are there just to point some instances where we had a large series of negative Yearly closes, for example in the 1930s and early 1940s the DJI closed down 3-4 years in a row and then in the 2000-2003 period we had the same, so these were the LONGEST Bear Markets in history.
I am going to repeat this: the longest Bear Markets in history, on the DJI, in the last 114 years, lasted ’bout 3-4 years, so if you are an Uber-Bear, you can expect probably something similar in the future (barring some devastating yet unseen crisis, for sure, but let’s be honest, you cannot predict that, so you must predict that a Bear Market will last from 1 to 4 years, maximum and I would bet, based on the above statistics, that in most of the cases it won’t last more than 1-2 years, so that is the maximum possible lifespan of happiness for a Bear, take note).
If you are still with me and have not fallen asleep yet, I will tell you that the green arrows are indicating some of the longest Bull Markets in history and here we can see some cases with 4-5 consecutive up years, and even a case with 9 consecutive up years (it was the 90s Bull Market) and the latest (current) Bull Market, 6 years up in a row as of 2014, with 2015 directed into closing up for the 7th year up in a row, unless something changes in the last 2 months of this year.
What does this say to you?
Off the top of my head, I would say that 7 years up in a row is a VERY OVERBOUGHT market, by historical/statistical means. Does that mean we will get a Bear Market finally in 2016?
Maybe.
You see, nothing is sure in statistics and even if the market this year closes up for the 7th year in a row, it does not give you the CERTAINTY that the market will close down next year (2016) and that there will be a Bear Market, however, based on the behavior of the market in history, you can certainly say that this Bull run is overextended and there has never been an excess in history of markets that has not been corrected at one point.
Is this time going to be different? Are we going to have 8,9 or 15 years up in a row?
We cannot exclude it for sure, but the odds are that the market won’t make it that far.
In the end of the day, when you are investing, you have to make a bet, an informed bet and statistics can help you figure out the average market behavior plus some tails (discard the once-in-a-lifetime outliers please), in order to acquire the information you need to make that bet. We have made one example here, but for sure you could figure out other type of analysis (just not volume, please, that is another useless noise source).
In conclusion, based on the analysis of the DJI Yearly data presented above, we think it’s fair to say that from here, and going into 2016-2017, there is a very high chance to see a Yearly negative Close, and thus a “Bear Market”. The size of this Bear remains unknown, but it will come very probably, just be patient.
How to make money out of it, ride it to the bottom and become a millionaire by investing 1000$ in some exotic OTM PUT is a completely different story, there is a very high degree of complexity in doing things like that (if they were ever possible) and we can’t tackle this topic so simply in a couple of paragraphs written on a blog, but as a minimum, if you are looking for some sort of bias for the next 2 years, in our view it starts to make sense to lean heavily on the bearish side, based on the study of the past DJI YEARLY close patterns presented above.
Disclaimer: keep in mind that there is no certainty in forecasting markets direction, just good odds, take safe bets and use Stop Losses.
