I’ve been distracted this week by a divorce hearing yesterday morning, but that’s out of the way now and I’m doing two posts today. This first one is talking about short term upside targets across SPX, NDX, IWM and INDU and the second one later today will be looking at the bigger picture case for a backtest of the 3750-3800 SPX area soon, and the potentially very bullish implications if we were to see that happen.
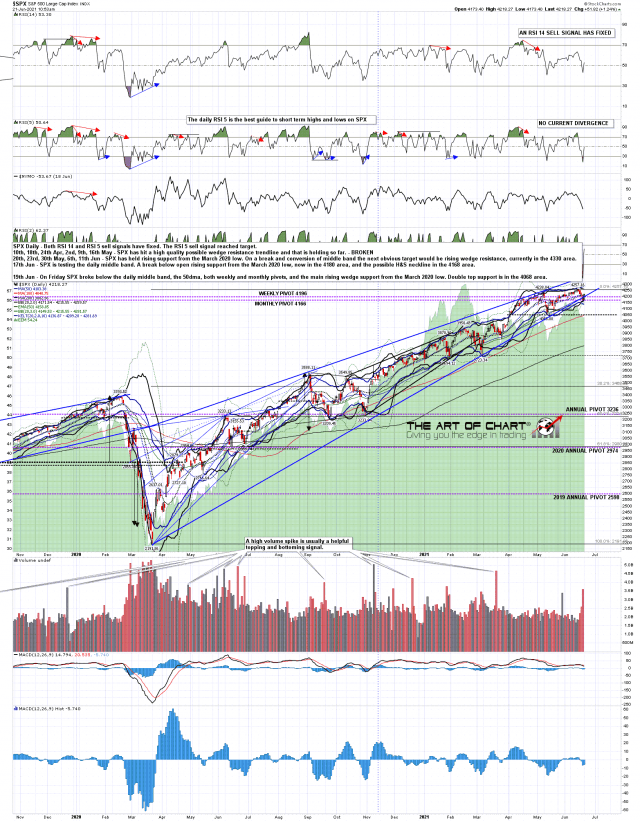
For now on SPX the wedge resistance trendline is in the 4400-10 area, and the retracement over the last couple of days could set up a very decent possible RSI 5 sell signal if SPX heads directly to that target from here.
(more…)