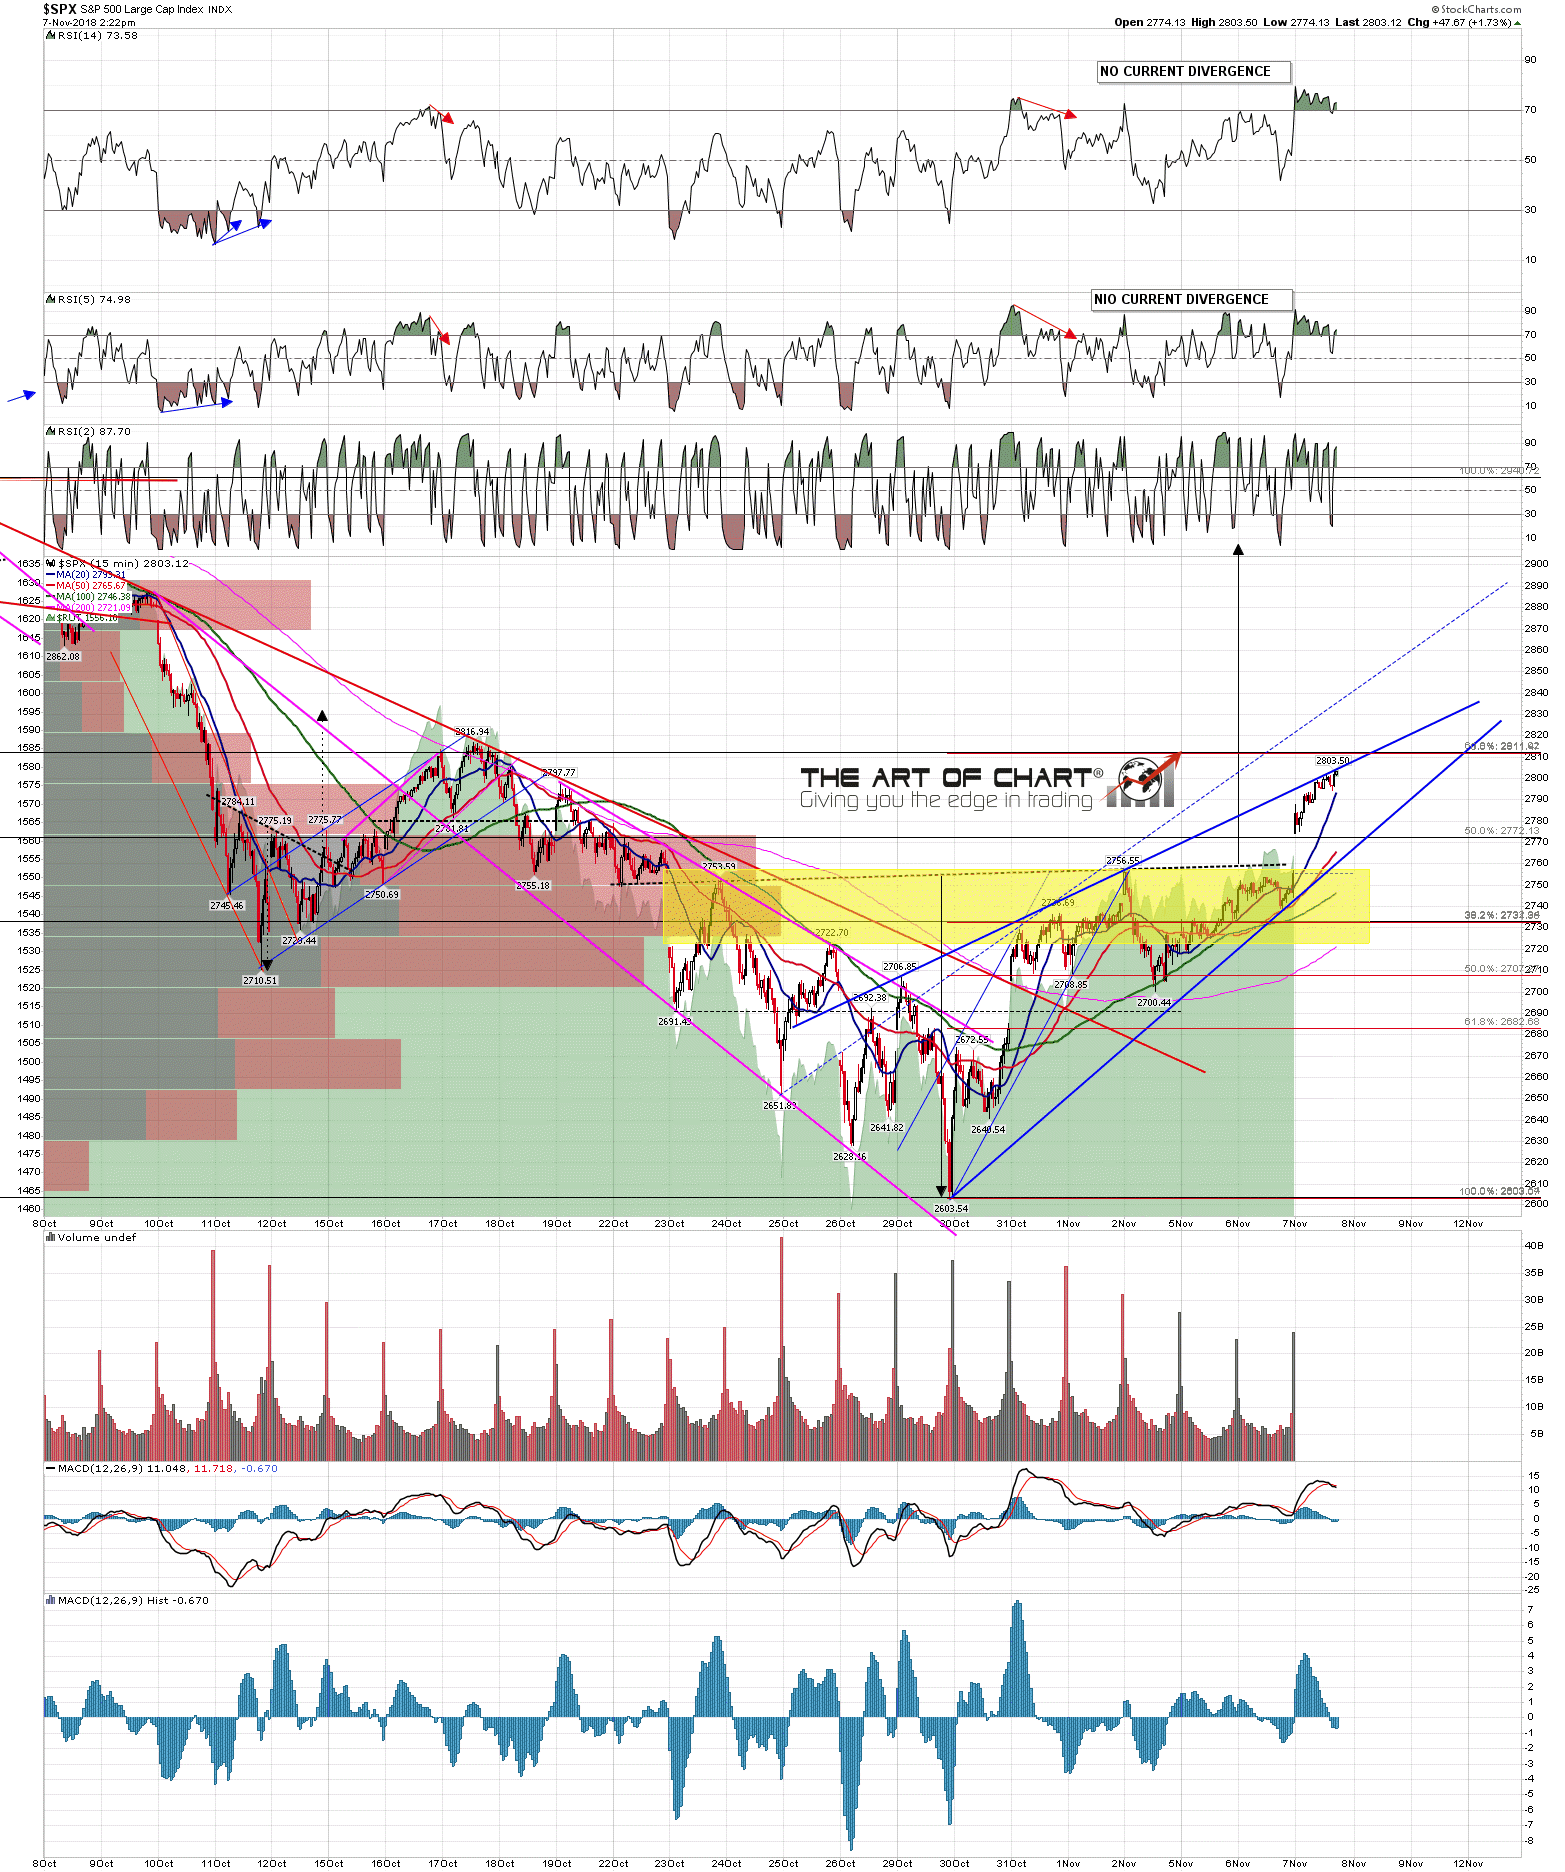
Slope of Hope Blog Posts

Slope initially began as a blog, so this is where most of the website’s content resides. Here we have tens of thousands of posts dating back over a decade. These are listed in reverse chronological order. Click on any category icon below to see posts tagged with that particular subject, or click on a word in the category cloud on the right side of the screen for more specific choices.

Rallying Into FOMC

By -

Last week I was talking about a backtest into the 5dma / 50 hour MA support area and we saw that, and another leg up over the daily middle band and the 50% retracement level that brings SPX up into resistance at the 61.8% retracement level at 2812 and the September rally high at 2816.94. I have a decent looking rising wedge from the low that has slightly overthrown wedge resistance and a lot of negative divergence on the 15min chart particularly. SPX 15min chart:

SPX min (more…)

Just the Stats Ma’am

By -

The close on SPX yesterday was a clear close back over the 5dma, and as it has been a decline of more than 2% since the last break down, that puts SPX back on the Three Day Rule. That means that if SPX should deliver a clear close (4/5+ handles) back below the 5dma, currently at 2684, today or tomorrow, then SPX would very likely retest the October low in the following few days.

When SPX is trending in either direction I watch the 5dma and the 50 hour MA for trend support or resistance. The 50 hour MA is currently in the 2694 area, so that and the 50dma give us the short term support area.

On the resistance side there is a possible IHS neckline in the 2725 area, and that’s still in play potentially if SPX breaks back under the 2685-95. That would have an ideal right shoulder low in the 2651/2 area, but in practical terms in the event of a daily close back under the 5dma SPX would likely deliver at least a new retracement low. (more…)

Looking At The Bigger Picture

By -

SPX retested the retracement low this morning, so the Three Day Rule target has been reached. This is a return to form after the first fail on this stat since the start of 2007 in April/May 2018. Still the strongest stat I follow. So what now?

From a cycles perspective there is a cycle high window in January, then a big cycle low in May 2019 at which we are thinking we should see the main low for this move. The ideal target for that low then would be a test of rising megaphone support from the 2011 low to be hit in the 2370 area, which would also be at the 50% retracement of the move up from the 2016 low. There are two very decent looking options for reversal on the way.

The first is in the the 2655-70 area, from where we could see a reversal to retest the high, to set up a double top looking for the main target area. (more…)

Don’t Fear The Reaper

By -

It has been a while since we have seen a Three Day Rule signal fix, in part because the rule requires an initial 2% decline, and those have been pretty rare over the last couple of years, but the Three Day Rule triggers when there has been a minimum 2% decline on SPX and then SPX closes back over the 5 day moving average. That is day one, and that happened on Tuesday. The rule looks at the next two days and if there is a close back below the 5dma on either day then the rule fixes. That close back below happened yesterday, on day three. On this statistic we could see a fairly marginal high over the current rally high this week, but whether we see that or not, SPX should retest the low at 2710 in the near future. The only exceptions to this rule since the start of 2007 were two instances when an overall triangle was forming, and rather than a full retest of the previous low there were marginal higher lows over that low in the next few days.

This is the highest probability stat that I follow, and SPX is very likely to retest the 2710 low in the next few days. (more…)

Need To Know Your ABC

By -

I was saying after the SPX support trendline touch a few days ago that having a strong three-touch support trendline cuts both ways, in that it is strong support while it holds, but can get ugly fast when it breaks. The strength of this push down after the support trendline broke on Wednesday morning was extremely impressive.

That move may be bottoming out for the moment and, if so, that should be the end of wave A, with a wave B rally in progress now or soon, and a likely wave C down after that to complete this move from the high. There are a number of possible options for the wave C low, but my favorite would be a retest of the 2018 low at 2532.69, just under the annual pivot at 2538. There is a possible H&S neckline at that level. If SPX does a 50% retracement from the current low then the target would be in the 2825 area, though there is impressive looking resistance in the 2790 – 2800 area that may hold as resistance.

Full Premarket Video from theartofchart.net – Update on ES, NQ, SPX, NDX, RUT, CL, NG, GC, SI, HG, ZB, KC, SB, CC, ZW, ZC, ZS, DX, EURUSD, USDJPY, USDCAD, AUDUSD: (more…)