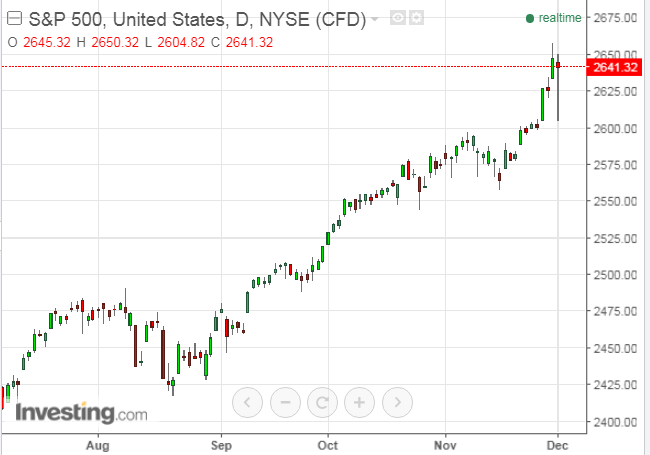
U.S. equity markets experienced a volatile intraday trading session on Friday, as news unfolded throughout the day with respect to the ongoing DOJ Special Counsel legal investigation of the Trump administration and its potential involvement with Russian interference in the 2016 election, as well as to discussions and a final vote on tax reform/cuts in the Senate, as shown on the Daily charts below of the SPX and VIX.