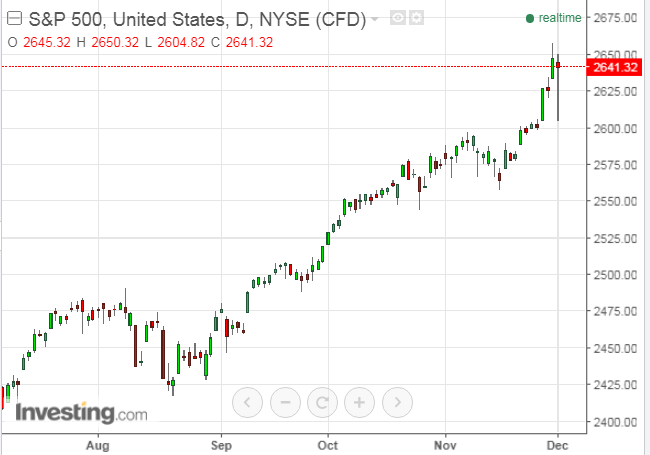
U.S. equity markets experienced a volatile intraday trading session on Friday, as news unfolded throughout the day with respect to the ongoing DOJ Special Counsel legal investigation of the Trump administration and its potential involvement with Russian interference in the 2016 election, as well as to discussions and a final vote on tax reform/cuts in the Senate, as shown on the Daily charts below of the SPX and VIX.

With regard to which one most influences the markets — political legal proceedings versus political legislative accomplishments — Friday’s action is indicative of a tug-of-war environment.
If Friday’s close presents any kind of snapshot of which one holds the most sway among market participants, it would seem that, as it stands right now, the scales are slightly tipped in favour of political legal machinations, based on a lower close of the SPX and a higher close of the VIX.
Volatility has been increasing since October 25, as evidenced by the expanding-triangle pattern forming on the VIX. However, with major resistance sitting around the 12.00 level, it will be important that price break and hold above that level as a potential signal that weakness is creeping in on the SPX. If it remains below that price, we could very well see buying return next week, particularly, since the Senate passed its tax bill after midnight, Friday.
However, the SPX is mashed up against major resistance in the form of an external Fibonacci retracement level, as shown on the Monthly chart below. It’s also trading above a +2 standard deviation level of a long-term uptrending Regression Channel (formerly major resistance/now major support around 2600). Such a channel breakout has not occurred since it began at its lows of 2009, so any further buying that occurs at/above these levels would be unusual and, potentially, lead to over-exuberant parabolic spikes.

I last wrote about the SPX:VIX ratio in my post of November 21.
Price on this ratio had briefly spiked above 280 (on November 3) to the upper edge of a long-term uptrending (green) channel, before it plummeted below that channel on Friday (to a low of 181.79) and spiked back up to close at 231.16, as shown on the Monthly ratio chart below. This represents a 100-point swing in the past four weeks (and a 65.41-point one-day swing on Friday), confirming that volatility is, indeed, on the rise (as social chaos continues to churn and expand, as well).
I’ll re-iterate that it will be important for price on this ratio to reach and hold above the 280 major resistance level, and for the SPX to hold above its 2600 major support level, in support of a convincing argument that favours the sustained entry of the SPX into a new bull-market phase.
Otherwise, if price drops and holds below major support at 200, expect volatility to increase and weakness to set in on the SPX.

In conclusion, we’ll see what happens with equities after the House has finished its debate on tax reform/cuts, which is scheduled to begin on Monday, and whether the ongoing political legal drama escalates/expands in the week(s) ahead.