Not only did the Nasdaq Composite make a new all-time high as it exceeded 6000 by mid-day today (Tuesday, April 25), but it did so on record-high momentum, as shown on the following Monthly chart.

Slope initially began as a blog, so this is where most of the website’s content resides. Here we have tens of thousands of posts dating back over a decade. These are listed in reverse chronological order. Click on any category icon below to see posts tagged with that particular subject, or click on a word in the category cloud on the right side of the screen for more specific choices.
Not only did the Nasdaq Composite make a new all-time high as it exceeded 6000 by mid-day today (Tuesday, April 25), but it did so on record-high momentum, as shown on the following Monthly chart.
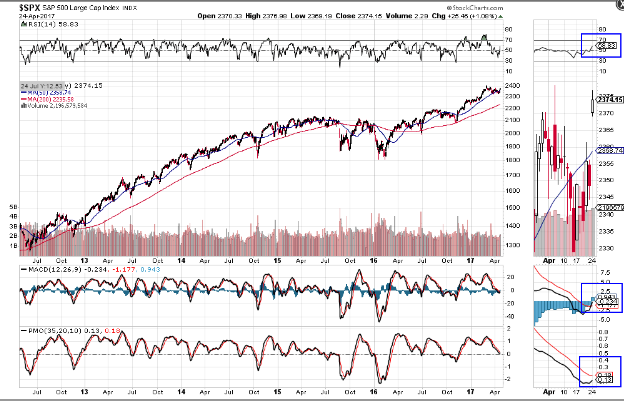
Even though the S&P 500 Index (SPX) did not reach a new all-time high today (Monday), the SPX:VIX ratio did, as shown on the following two Daily charts.
Keep an eye on the ratio, since an RSI above 50 and upside crossovers on the MACD and PMO indicators are signalling that a new bull market is shaping up for the SPX. Such a breakout would need to be confirmed by a bullish crossover on the PMO, with the crossover maintained on the MACD and the 50 level held on the RSI on the SPX.

As can be seen from the following Monthly chart of the EUR:USD Forex pair, after today’s (April 23) first round of the French Presidential election, price is currently in a battle to regain a foothold above major resistance at 1.09.
A break and hold above this level could see a further push to the next major hurdle around 1.15. At the moment, the Momentum indicator is still below zero…watch for a confirming break and hold above that level on such an upward push. Otherwise, failure to break above 1.09 with conviction could see a retest of 1.03, or lower.
As of mid-day on Friday (April 21), and during the past couple of range-bound months, the Technology sector is outperforming the large-cap and small-cap stocks, as shown on the following charts.
It’s still sitting above both its 20 and 50 day moving averages, while the Dow 30, S&P 500, S&P 100, Nasdaq 100, Nasdaq Composite and Russell 2000 Indices are below their 50 MA, with bearish 20 and 50 MA crossovers.
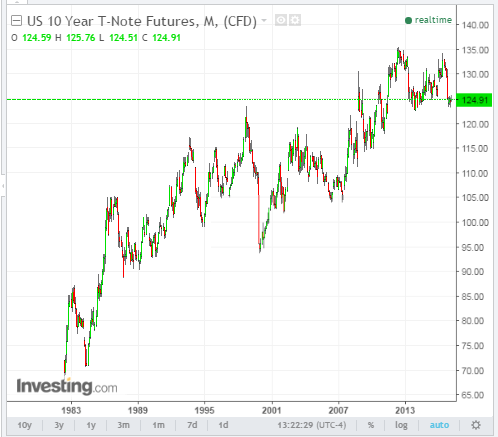
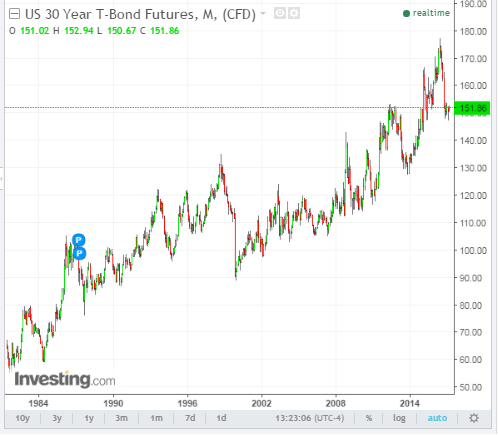
As can be seen from the following long-term view of 10 and 30 year bonds (monthly charts), each is facing an imminent decision…whether to break fairly substantial major support at their current levels and, potentially, fall to levels not seen since the 2008/09 financial crisis, or resume their flight-to-safety bounce to retest prior highs.