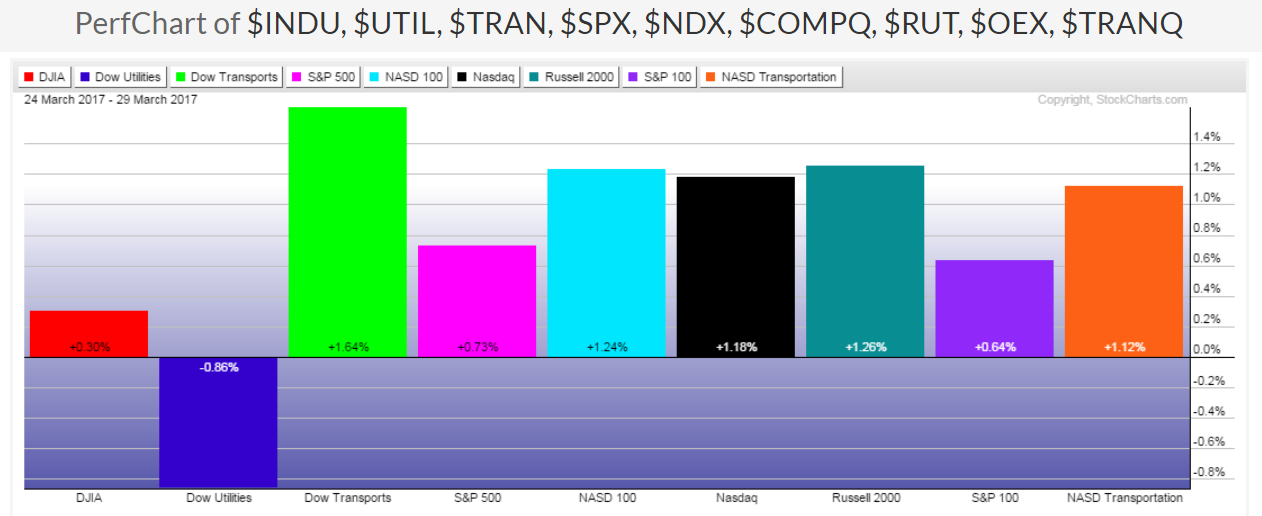
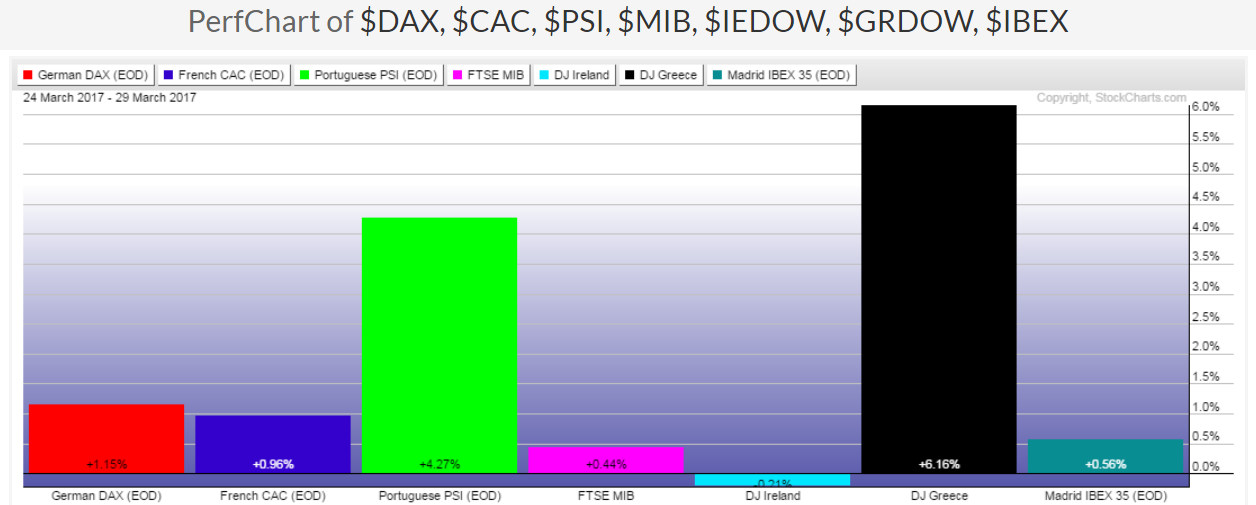
The following five percentages gained/lost graphs show, at a glance, which countries and currencies gained the most, so far, this week (Monday, March 27 to, and including, Wednesday, March 29).
Slope initially began as a blog, so this is where most of the website’s content resides. Here we have tens of thousands of posts dating back over a decade. These are listed in reverse chronological order. Click on any category icon below to see posts tagged with that particular subject, or click on a word in the category cloud on the right side of the screen for more specific choices.
The following five percentages gained/lost graphs show, at a glance, which countries and currencies gained the most, so far, this week (Monday, March 27 to, and including, Wednesday, March 29).
Three Trillion dollars gained in the U.S. markets since the Presidential election in November 2016 are now at risk…and more.
With the recent failings of two attempts by the President to implement temporary travel restrictions from several foreign countries via his executive orders, and the failure of Republicans to reach a consensus on passing a bill that would have repealed and replaced ObamaCare, one has to wonder whether Republicans can, in fact, ever reach agreement on any of President Trump’s economic, fiscal, national security, tax and regulation reform, and immigration reform agenda.
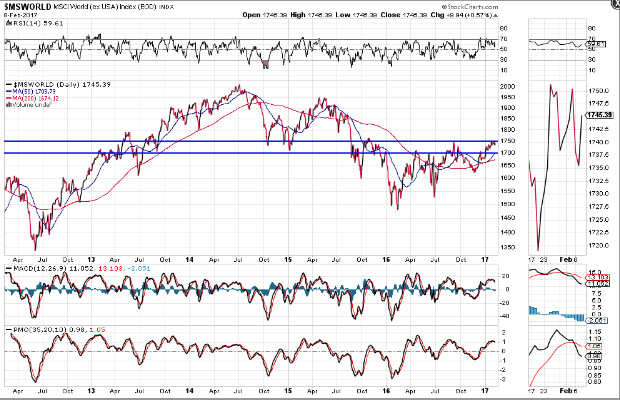
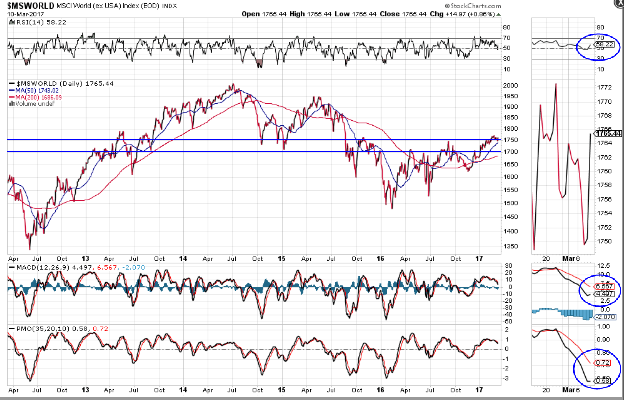
In my post of February 9th, I mentioned the importance of the World Market Index breaking, and holding above, 1750, as a potential signal of support for world equities, in the longer term, including that of the S&P 500 Index (SPX).
Since then, the World Market Index has, indeed, broken above and dipped back below 1750 several times, and closed out this week (March 10th) just above that level, as shown on the Daily chart below.
The RSI is in downtrend, but popped back above the 50 level, while the MACD and PMO indicators have yet to form bullish crossovers and remain in downtrend.
 |
|
Daily World Market Index |

In this new world of technology and its attendant problems of the hacking of gadgets and products, Apple’s iWatch now takes on a whole new meaning after WikiLeaks published material yesterday that is purported to be CIA documents and files related to U.S. intelligence cyber and spying activities.
Apple (AAPL) is nearing a convergence of a couple of Fibonacci levels that may serve as resistance around 145.00-146.00, as shown on the following Weekly chart.
Further to my post of November 24, 2016, the World Market Index did, subsequently rally and is now stuck in a trading range between 1700 and 1750, as shown on the Daily chart below.
In that post, I mentioned the importance of a break and hold above 1750 as a potential signal of clear support for world equities, in the longer term, including that of the SPX.
You can see that a new “SELL” signal has just been triggered by the bearish crossovers of the MACD and PMO indicators.