Slope of Hope Blog Posts

Slope initially began as a blog, so this is where most of the website’s content resides. Here we have tens of thousands of posts dating back over a decade. These are listed in reverse chronological order. Click on any category icon below to see posts tagged with that particular subject, or click on a word in the category cloud on the right side of the screen for more specific choices.

World Market Outlook Post-Trump Win

By -

My apologies for such a long post, but I have a lot to say…

This post will look at where “outliers” are sitting in a variety of world markets, as of the close of the week that saw Donald Trump win the race for U.S. President (those instruments sitting at relatively high or low price levels compared with their respective counterparts and in relation to major support/resistance levels).

They will be shown on the following 1-year Daily chartsYear-to-date gains/losses comparison graphs, and several 5-Year Ratio charts, and will be grouped in the following 10 categories:

  • Major U.S. Indices
  • 9 Major Sectors + Homebuilders
  • Major European Indices
  • Emerging Market & BRIC ETFs + BRIC Indices
  • Canada, Japan, UK, Australia + World Market Index
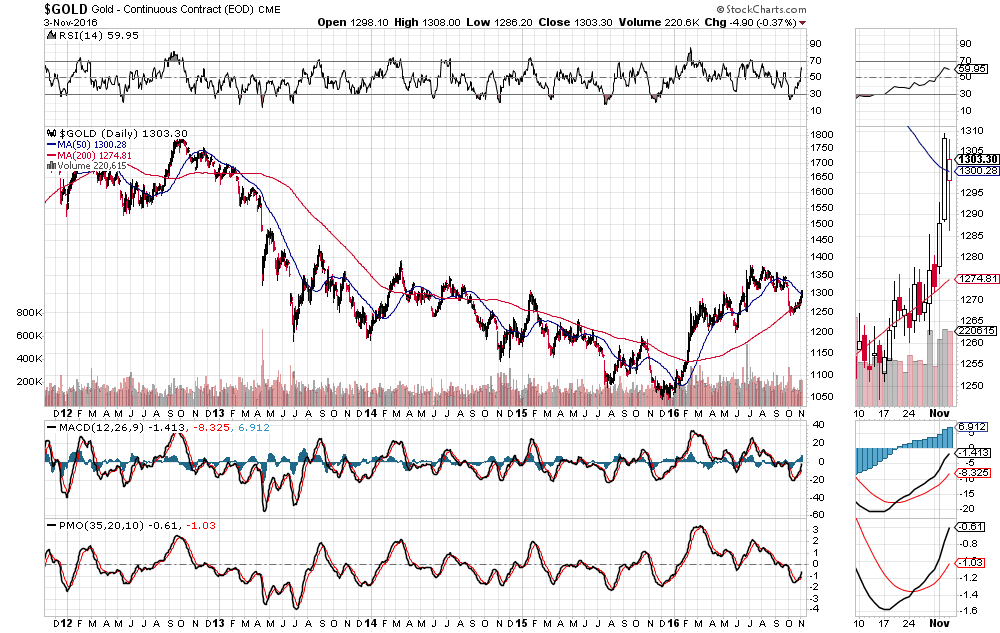
  • Commodities + US $ + US Bonds
  • Major Currencies
  • SPX vs World Market Index
  • Financial ETFs vs U.S., European & Chinese Major Indices
  • Retail ETF vs SPX

MAJOR U.S. INDICES

(more…)

The Rocky Road of the SPX:VIX Ratio

By -

Well, since my last post on the SPX:VIX ratio, we find that, after true-to-form recent volatility in between 150 and below 100 to just above 90, it has, once again, spiked upward, broken and closed above 150, as shown on the following Monthly ratio chart.

The Momentum indicator has rallied and is, again, back above the zero level, which now favours the bulls on this longer term timeframe.

(more…)

The Bubble No One Talks About

By -

What is it?  The MEDIA BUBBLE!

Seriously, who has time to check out all available sources of news these days? And, where do you start? Who do you trust for fair and accurate information?

Middle-class working folks are too busy trying to earn a living and create a healthy and balanced life for their families to worry about who is saying what and try to figure out who’s relaying true facts.

(more…)

Gold on Track to 1400

By -

GOLD closed just above 1300 and the 50 MA for a second day in a row, as shown on the following Daily chart. The RSI and MACD downtrends have now been broken to the upside.

The next major resistance level is around 1400. I’d watch to see if the PMO indicator crosses and holds back above zero to see whether such a rally, or continued rally beyond that level, has legs.

In fact, there is thin volume above 1400, as depicted by the pink Volume Profile along the right-hand side of the Weekly chart below, so you could see a price surge above 1400 to, potentially, 1500, which is the next major resistance level. Watch for a Golden Cross of the 50 MA back above the 200 MA on this timeframe to confirm such a surge.

GOLD Daily chart

(more…)

Russell 2000 Dead Cat Bounce?

By -

I’d keep a close eye on the Russell 2000 Index to see whether it continues its recent downward plunge below its (now-broken) support and influences the other three Major Indices to follow suit.

The following Year-to-date comparison chart of percentage gains/losses shows that the RUT has lost the most recently (because of its prior double-top spike to 11%), but that all four Major Indices are roughly even in percentage gains now for the year…we’ll see if that was just a dead cat bounce and whether the SPX:VIX ratio does plunge below the 100 level, as I mentioned here.