Slope of Hope Blog Posts

Slope initially began as a blog, so this is where most of the website’s content resides. Here we have tens of thousands of posts dating back over a decade. These are listed in reverse chronological order. Click on any category icon below to see posts tagged with that particular subject, or click on a word in the category cloud on the right side of the screen for more specific choices.

Panic Selling Ahead for Equities?

By -

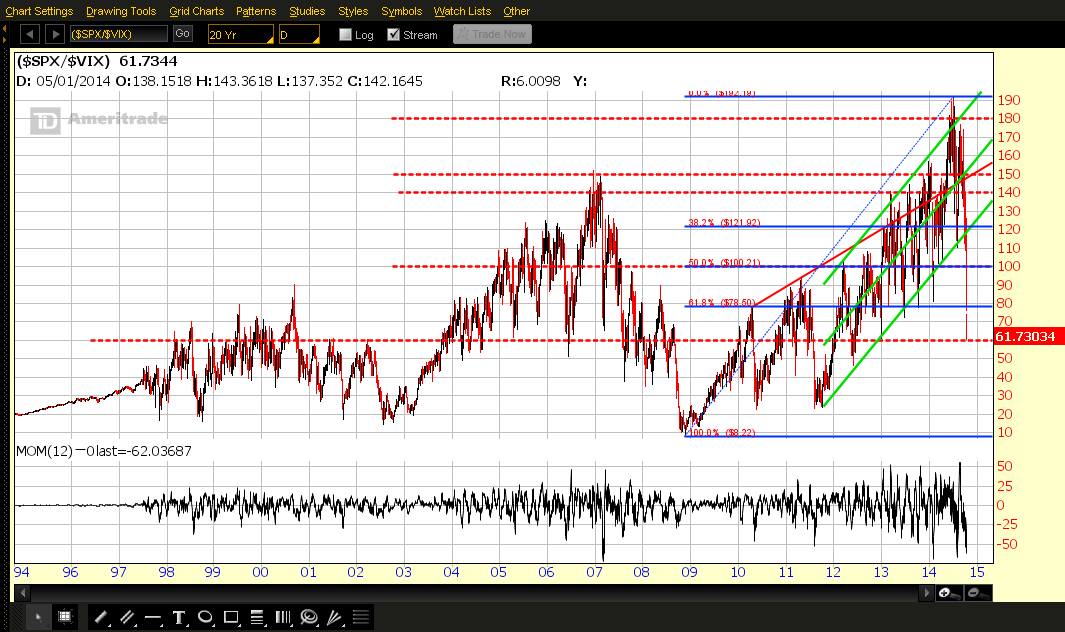
As of 2:00 pm today (Wednesday), and further to my post of October 9th, price in equities has plunged to the next major support level of 60.00, after failing to hold a critical level of 100.00, as shown on the 20-Year Daily ratio chart of SPX:VIX below.

Price on this ratio chart now sits at levels seen during the 2008 financial crisis. A break and hold below this level could, indeed, cause some panic selling in equities…one to watch very closely over the coming days/weeks!

I’ll post an updated chart after the market closes today…check back here for the update.

Double-Top Rejection at Triple-Fibonacci Resistance for Japan’s Nikkei Index

By -

It’s been awhile since I wrote about Japan’s Nikkei Index (NKD)…July 31st at this link.

After an initial drop at the right shoulder of a Head and Shoulders formation that was in play at the time, price rallied and has, once more, pulled back at the confluence of a double-top price level and triple-Fibonacci resistance level, as shown on the following Weekly chart.

Failure to hold its current level of 15,000 could, potentially, send price tumbling to around the 13,700 major support level, or even 12,600. Alternatively, watch for any increase in volumes on rallies…otherwise they may simply be dead-cat bounces, as has been the case since November of 2013.

Triple-Bottom Bounce on Gold After Re-test of Critical Support Level

By -

As shown on the 5-Year Weekly chart of GOLD below, price has bounced this week [as of today (Thursday)] at a triple-bottom major support level of 1180, which began in June of 2013.

This critical support level converges with the bottom of the weekly Bollinger Band, along with the lower edge of a large declining channel (which began after the all-time high of 1923.70 was made during the week of September 5th, 2011).

Failure to hold above the critical 1180 support level could see a much larger decline ahead, possibly to the 1000 level, as shown on the next 20-Year Weekly chart. Bulls will need to re-take 1300 and hold that level before we likely see any further serious commitment to, ultimately, reverse this long-standing downtrend on the weekly timeframe. (more…)

Hanging Man Formation on USD/CAD Forex Pair

By -

The 10-Year Weekly chart below of the USD/CAD Forex pair shows a bearish “hanging man” formation on this week’s candle…signalling a potential weakening of the U.S. dollar against the Canadian dollar. Price hit the confluence of a major triple-top resistance level, 50% Fibonacci retracement level, upper Bollinger Band, and upper Channel last week.

(more…)

Volatility on SPX:VIX Ratio Pair at Critical Level

By -

I last wrote about the SPX:VIX ratio in my post of August 15th. I mentioned that failure to hold above the 150.00 level would likely see a prior gap up filled, while a break and hold below the 110.00 level would likely see a larger-scale correction begin in equities.

Since that date, price on this ratio finally fell below 150.00 on September 22nd (after re-testing that level and rallying on a dead-cat bounce), as shown on the 20-Year Daily chart below, and closed today (Thursday) just above the 100.00 level (filling the gap in the process). This increase in volatility is not surprising after this ratio pair put in a massive outside bearish engulfing candle on the Monthly timeframe, as I had noted in my post of July 31st. (more…)