
The 10-Year Weekly chart below of the USD/CAD Forex pair shows a bearish “hanging man” formation on this week’s candle…signalling a potential weakening of the U.S. dollar against the Canadian dollar. Price hit the confluence of a major triple-top resistance level, 50% Fibonacci retracement level, upper Bollinger Band, and upper Channel last week.
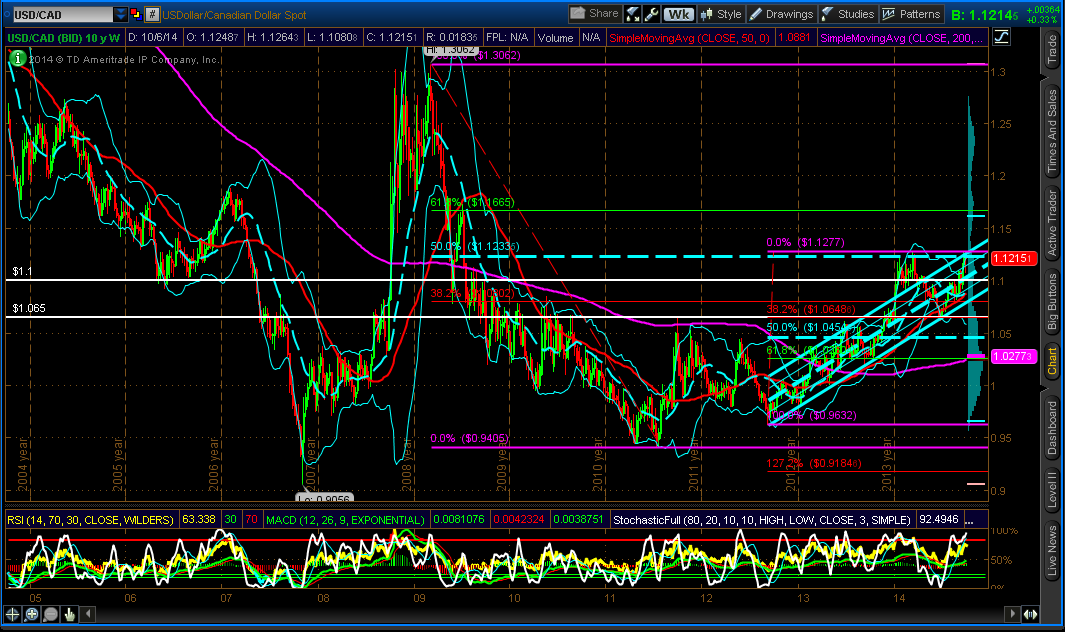
A break and hold above 1.1277 could see price spike up to 1.1665 (which is the next Fibonacci resistance level), particularly if Canada’s TSX continues its plunge, after closing today (Friday) at 14,227.36. Otherwise, there is some support around the 1.10 level should the Canadian dollar strengthen against the American dollar.
The following Daily chart of the TSX shows that price has closed at a major support level. A drop and hold below this level could see price continue down to around 14,000, or even 13,500 before it consolidates or bounces. The RSI, MACD and Stochastics indicators are all very oversold, but none have confirmed a turnaround in price yet.
Watch for any co-relation in price action in the coming days/weeks between the USD/CAD and the TSX for possible clues in direction on both.

