Slope of Hope Blog Posts

Slope initially began as a blog, so this is where most of the website’s content resides. Here we have tens of thousands of posts dating back over a decade. These are listed in reverse chronological order. Click on any category icon below to see posts tagged with that particular subject, or click on a word in the category cloud on the right side of the screen for more specific choices.

GDP Q4 2010 (by Ultra Trading)

By -

Today's Q4 GDP revision was far below expectations.  Originally reported at 3.17%, real GDP for the fourth quarter was revised down to 2.79% growth.  Government, once a form of stimulus for economic growth has now become a drag at (.20%) of GDP.  The consumer, thought to be strong came in weaker and was revised down as well by .16% although still contributing to growth.  

Below is a summary of the original GDP versus the revisions.  Overall, for an economy two years out of recession having experienced trillions in stimulus, this is not a good report.  The data reported by BEA is real GDP and to convert from nominal to real the BEA uses two different inflation measures.  They use a less aggressive number on the overall report yet on the import component which per the formula is a drag on GDP a more aggressive number.   This questionable number many would argue easily overstates real GDP and in fact growth is far lower than reported.


Screen shot 2011-02-25 at 9.30.32 AM

Submitted by Ultra Trading.  If you would like to read more, please visit - Ultra Trading

AAII Sentiment Survey – Week Ending 2/22 (by Ultra Trading)

By -

WOW!  Check out the reversals in market sentiment over the past week.  The AAII report is through Tuesday so Libya would be "priced" in here.  Still, the moves are massive.  Bullish sentiment dropped to 36.6% from 46.6%.  Bearish sentiment rose to 36.1% from 25.6%.   Buying the dip may be out of favor for a period of time as fear has really crept back into the market.   

The SPX has correlated very well with the AAII data as shown below.  The divergence between the two is pretty large right now.  Time will tell if the red line or blue line is wrong.  


Submitted by Ultra Trading.  If you would like to read more, please visit - Ultra Trading

Quantitative Easing And The Treasury Market (by Ultra Trading)

By -

The slide in treasuries continues again and it is clear the Fed has lost any control of the entire curve beyond a one year maturity.   Equity markets are at a very critical juncture right now with QE2 expected to end in June.  The reality is equity markets may very well begin pricing the end of QE in the near future, if you consider the Jackson Hole speech hinted at QE2 in August and saw equities price in the policy three months ahead of the November 2010 meeting.  

There is no shortage of people calling for endless QE (easily 80% of those voices truly don't even understand QE).  The environment now though has changed making the options to Fed monetary policy more limited. Probably the biggest headwind facing the Fed is rising interest rates.  The federal funds rate is at 0-25 bp and QE was intended to push down rates further out on the curve and it did work for a while.  The Fed conditioned all of us for low rates with their continual use of "extended period" with each FOMC statement.

The Fed needs to be careful moving forward.  The bond market has clearly signaled they are concerned about inflation, loss of confidence in the Fed and US fiscal policy.  The US is competing with other sovereign nations for capital at the same time they are increasing their supply with growing deficits. Imagine a shock even to the US economy.  The US is in no position to use emergency stimulus without risk of truly blowing out yields.

Two Year Treasury 

After catching a little bid last week the two year has given up all its gains and looks to test the lows again. The shorter end of the curve had stayed relatively low in yield but has risen more than any other maturity recently causing a bear flattening (higher rates and a flatter curve).  Not favorable for banks or those on the wrong side of interest rate swaps (which is a $458 trillion market).


Ten Year Treasury 

Has bounced along a multi year trend line after failing last week.  Looks like it too is set up for failure. This is not good for housing which is already under pressure and double dipping.  A 100 bp rise in 10 year yield equates to about an 11% drop in home prices.


Submitted by Ultra Trading.  If you would like to read more, please visit - Ultra Trading

COT Report Week Ending 2/15 (by Ultra Trading)

By -

This week's Commitment Of Trader report has a few notable divergences but overall sends a somewhat mixed message on short term market direction.  

Oil V Copper

The past few weeks copper has continued to show far greater strength than oil, setting new highs almost regularly.  Oil appears to be rolling over and then another Middle East country erupts causing a spike, that is subsequently sold off.  I present this chart below to simply show how the two have begun show a larger divergence than normal.

Copper V Commercial Net Positions
A few weeks back commercial net positions had become more net long indicating pending copper weakness, but that trend has changed.  This chart would imply copper will continue to show more strength.  The only note I would add is the chart of copper appears to be forming a top similar to April 2010.  It is also notable that the net short position for commercial is reaching its prior highs.  


Oil V Commercial Net Positions
A pretty large divergence is showing here.  Oil is moving down while commercial net positions are increasingly net short.  This is by far the highest net short position commercial traders have had in over a year.  No real conclusion can be drawn from this chart.


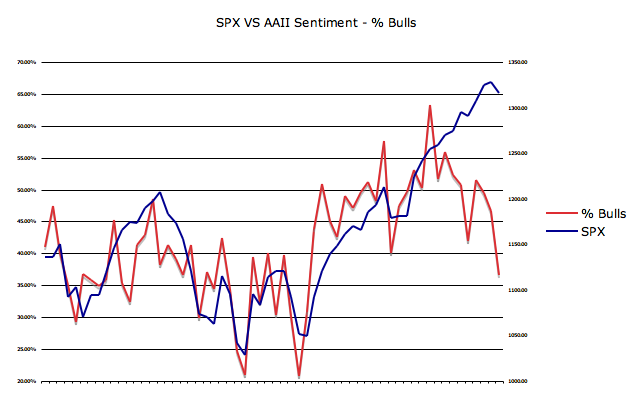
SPX V Commercial Net Positions
Last week I pointed out the growing divergence between these two data points.  It has continued to grow and based purely on the prior correlations would imply pending SPX weakness.
USD V Non Reporting Net Positions
Understanding USD direction has become almost impossible.  In the face of geopolitical tension, the fear trade has not resulted in USD strength as in prior times.  The only notable comment to draw from this chart is it appears non reporting positions are ahead of the price action in the USD.  Since this group of traders is almost always wrong, continued USD weakness is quite possible.  The USD is also setting up for another test of a multi year trend line.


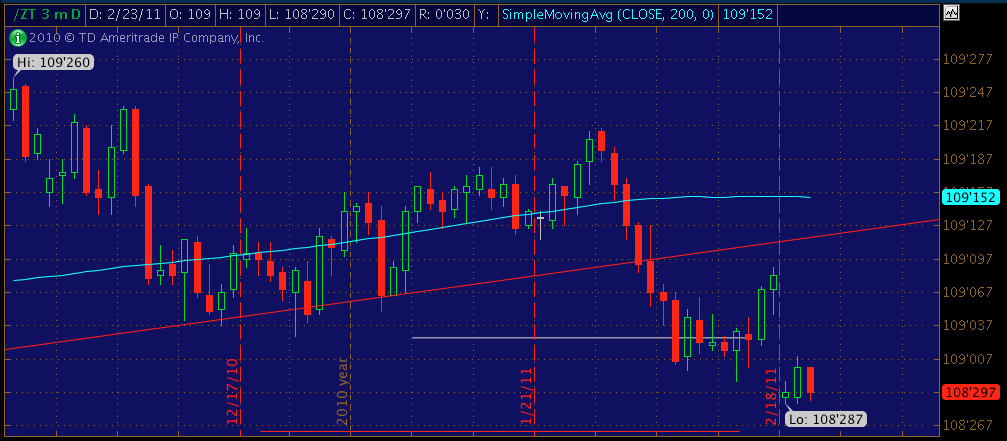
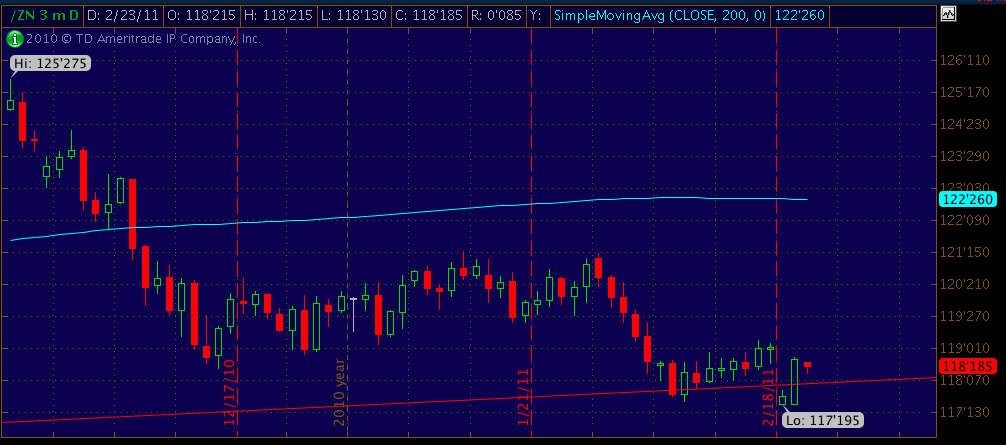
30 Year Treasury V Commercial Net
Commercial net positions have continued their move towards net long implying further treasury weakness (higher yield) which would also support the technicals on the treasury price action of late.


Submitted by Ultra Trading.  If you would like to read more, please visit - Ultra Trading

Future Bank Earnings

By -

The chart below is very interesting and supports the recent commentary by Chris Whalen that banks are sitting on far bigger losses than they are reporting.

The volume of foreclosure sales has stayed relatively flat yet the serious delinquent category has grown much faster.  Foreclosure inventory has not kept up with the growth in delinquency either.


I've heard reports of people not paying a mortgage for months, in some cases over a year.  That would be a delinquent credit, yet the banks in those instances are ignoring this non-performing credit.  Unless notice is given, the credit is performing and not delinquent.   Why do that? Why would a bank let someone not make a mortgage payment for months? Why does the foreclosure process take up to 19 months for the top banks?

It's all part of extend and pretend.  When a credit is delinquent, the bank is still accruing interest on that note even though the probability of collecting that accrued interest is very low. Additionally the asset is marked at full value.  When a bank finally seizes a property it becomes an REO (Real Estate Owned) and that is when the hit to the balance sheet for the value of the asset and the income statement for the accrued interest happens.

What we have seen the past few reporting seasons is banks reducing their reserves for credit losses when in fact there is a mismatch between their realized losses and future losses.   They claim improving credit quality and perhaps that is true but they still are under reserved.  Should housing take another leg down, strategic defaults will occur and this problem will grow.  For now banks are balancing their dwindling profit with balance sheet write downs.  This, is why the US economy is being held hostage by the TBTF banks.  The last thing they want to do is extend credit to anyone without a perfect credit score and very low LTV .

Submitted by Ultra Trading.  If you would like to read more, please visit - Ultra Trading