Slope of Hope Blog Posts

Slope initially began as a blog, so this is where most of the website’s content resides. Here we have tens of thousands of posts dating back over a decade. These are listed in reverse chronological order. Click on any category icon below to see posts tagged with that particular subject, or click on a word in the category cloud on the right side of the screen for more specific choices.

COT Report Week Ending 2/8 (by Ultra Trading)

By -

Not a whole lot of conclusions to be drawn from this week's COT report. The commercial positions for Oil and SPX Consolidated are showing a pretty large divergence. Additionally commercial traders look more positioned for treasury strength (lower yield) in the coming week(s).  Beyond that though, the charts speak for themselves.

Copper:

Commercial positions reversed and are trending more short as copper continues to catch a bid.  It will be interesting to see if their position reverses as it approaches a prior high or continues signaling more copper strength.


Oil:

Pretty interesting chart here.  Commercial positions continue to trend more net short even while oil fell in price after Egypt settled down.  This data is for Nymex and not Brent crude.  Looks like oil though is due for a decent move up in the coming week(s) at least that is how commercial traders are positioned.


SPX:

I'm not well versed on this chart.  What caught my eye though was the divergence the past few weeks and especially this most recent week.  Commercial positions have trended to a far more neutral position. The commercial position is somewhat correlated with the SPX but in the past year has not seen such a divergence.  


USD:

This is a rather confusing chart.  The first half of 2010 for the most part there was a direct correlation but since then the two have inversely correlated.  The only note to make is that the divergence is wider than it has been and the commercial position has not been this net long before.  Two equally compelling conclusions can be drawn here.  


Long Bond:

As the 30 year continues to sell off in price, commercial positions have begun to turn slightly net short while the divergence between price and their position is rather large. This would imply pending treasury strength (lower yields) at least in the long end of the curve.   


Submitted by Ultra Trading.  If you would like to read more, please visit - Ultra Trading

AAII Sentiment Survey – Week Ending 2/8 (by Ultra Trading)

By -

The most recent AAII Investor Sentiment shows a continued favor towards the bullish camp.  The % bullish dropped 2.1% to 49.4% but is still above the historic rate of 39%.  The % bearish stayed at 26.9% as in the prior week and is below the historic rate of 30%.   

The charts below indicate that bullish sentiment continues to stay elevated but has not not moved higher with the SPX and based on the historic correlation, SPX appears due for a pullback.


Submitted by Ultra Trading.  If you would like to read more, please visit - Ultra Trading


Stay Focused (by Ultra Trading)

By -

If you are a longer term trader and not a day trader then it is very important to stay focused on the issues facing the global economy.   The issues are very real and have yet to be confronted in a serious manner, one that will achieve true resolution.  In the day to day noise of ES futures or pundits that are all in and refuse to question their long trade it is very easy to get distracted and drawn into the power of group think.  As investors we need to understand the environment in which we risk capital to determine how the risk and reward coexist.  Sometimes this means missing powerful moves up as I personally have. Other times it means realizing that early to a trade is the same as being wrong, again as I personally have learned. 

I continue to sit on hands until the following items are priced into this market for I feel these issues are very real and skew the risk reward equation far to the risk side. 

EU Debt 

Portugal 10 year yields are at 7.3% as of February 8 (7% is the threshold for the need for ECB / IMF support).  Ireland has asked for an additional 40% in funding to support banks that are faced with an acceleration in deposit runs and reduction in credit quality.  Italy is facing a leadership change as Berlusconi is now very likely to face charges for his sexual escapades.  Recent reports have raised the question that Greece should default as their ability to repay their debt is growing impossible. 

Global Unrest

Yesterday, Egypt saw its largest protest to date.  Just when it appeared Egyptians were tiring, they were rejuvenated by the release and subsequent statement by a Google executive.  Protests have spread to Saudi Arabia, Yemen, Syria, Jordan, Algeria and more.  This movement is just getting started in my opinion. 

QE 

Bernanke is coming under greater pressure to cease QE2 in June and not commence QE3 thereafter. From rising bond yields, inflation concerns to growing internal dissent the case for QE3 is becoming more difficult.

China 

This is a big question mark that should not be ignored.  China has grown more hawkish in their monetary policy yet US markets have ignored this completely.  China is trying to slow its real estate growth as its economy grows from one that is export driven to consumer driven.
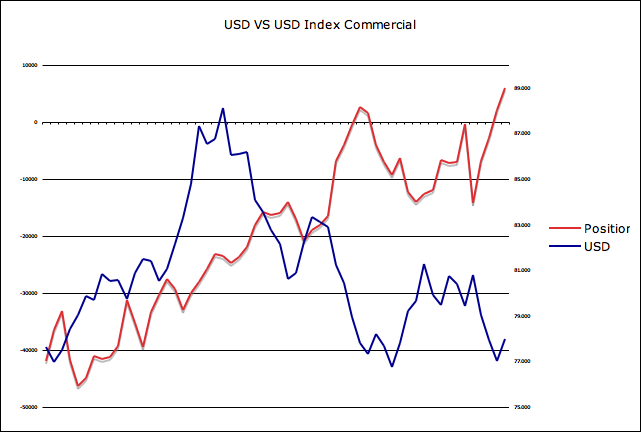
Currency

China, India, Russia and many others are increasing their precious metal reserves as they realize the day of the USD reserve status is diminishing and are now trading with non USD currencies.  Charts of the USD look simply horrid and other than a two day bounce cannot reverse trend.  Meanwhile with all the problems facing the EUR it has shown greater strength.  So in the race to the bottom, the USD appears to be winning.

Asset Prices

Residential and commercial real estate have not bottomed as many pundits will lead us to believe.  The levels of residential mortgage underwater are growing that will lead to further strategic defaults, thus higher levels of shadow inventory further pressuring home prices. A recent report from Fitch said that over 30% of commercial real estate that needs to be rolled in 2011 do not meet their standards.  We have far more real estate than this economy and job market can support. 

Unemployment 

The job market is horrid.  Regardless of the weather pattern behind a specific report the bottom line is the US has yet to create the minimum of 160,000 jobs needed each month to simply keep up with population growth.  We have a structural problem in this country and it will not be solved by QE.  20% of income is in the form of a government transfer payment yet only 49% pay taxes.  Meanwhile 1 in 7 Americans are on food stamps and this trend shows no sign of reversing.

I can go on with this list and more detail for each subject but the message is tiring.  This market can stay elevated for another hour, another week, another few years.  No one knows.  Many have learned not to stand in front of this market but as investors its important to understand the issues that surround us aside from the noise.  We must be ready to act when the market begins to price in the above items.  It is human nature to ignore problems we are faced with.  That is exactly what is occurring right now among our leaders.  That will not cause them to go away but only grow.

Submitted by Ultra Trading.  If you would like to read more, please visit - Ultra Trading

Treasury Yields – What Is Driving Them? (by Ultra Trading)

By -

In a prior post, I commented on the move in treasury yields since QE was first mentioned by the Fed in August of 2010.  The very short end of the curve has not budged but as you begin moving beyond one year and especially five years to ten years yields have moved substantially higher.

In the equity markets there is talk of the Bernanke put.  If any market should welcome this free option play it should be the bond market.  After all, the Fed has communicated regularly their goal of low rates for an extended period and the launch of QE to specifically keep rates low.  The Fed has said to the bond market we will put a floor under your security.  For some reason though the bond market has decided to take their ball and play elsewhere.  QE1 did manage to keep yields low when RMBS was being purchased.

There are a number of possible explanations for this move higher in yields.


  • The Fed has encouraged yield chasing and with commodities rising 30% in a matter of months or equities up 25% in five months, why invest in a ten year bond yielding 3%?  It would take you ten years just to match a three month return on a long rice trade.


  • The economy is improving so quickly that bond investors are demanding higher rates as the Fed will be forced to raise rates sooner than currently forecasted.  The problem with this argument is once QE2 was hinted at, rates began moving.  Perhaps the bond market was so confident in the success of QE2 and its ability to stimulate economic growth that bond yields responded immediately.  The results of QE1 combined with trillions in Federal stimulus did little to improve economic growth so why would QE2 be any different? 


  • Inflation is a concern and nominal yields are moving accordingly.  If you look at the TIPS market though (TIPS are inflation adjusted or real yields) inflation does not look to be much of a concern. The Fed's target for inflation is 1-2% annually so inflation is a concern beyond ten years but not much at just 36 basis points above the upper target.

                 5 Year Inflation – 1.50% in August 2010, now forecasted at 1.98%

                 10 Year Inflation – 1.86% in August 2010, now forecasted at 2.36%

                 30 Year Inflation – 2.18% in August 2010, now forecasted at 2.55%


  • The bond market is beginning to truly question the sustainability of US fiscal policy in the face of growing debt as a percent of GDP.  The question I would raise is why now?  Why not a few years ago?   The reality of investing in US treasuries is you are relying on additional debt to pay back your existing debt. The greater fool theory is the key to this market unfortunately.


The reality behind this move in yields is probably a combination of all of the above.  I was surprised in looking at the TIPS data to see how low inflation expectations truly are.  I think the inflation or deflation argument comes down to one simple truth.  Does QE choke off the remaining final demand in the economy before velocity explodes the money supply?  My vote is the former.  The bond market is sending a signal and one that needs to be watched as it will have direct implications on future monetary and fiscal policy. Let's hope it finally forces some discipline at the Fed and DC.  

Submitted by Ultra Trading.  If you would like to read more, please visit - Ultra Trading

Fed – Extended Period (by Ultra Trading)

By -

The Fed has clearly stated its policy regarding the Federal Funds rate with each monetary statement

"The Committee will maintain the target range for the federal funds rate at 0 to 1/4 percent and continues to anticipate that economic conditions, including low rates of resource utilization, subdued inflation trends, and stable inflation expectations, are likely to warrant exceptionally low levels of the federal funds rate for an extended period."

Let's take a look at other rates which are less controllable by the Fed as witnessed by changes since August 2 when hints of QE began surfacing.


  • 1 Month: gained 1 bp (basis point)
  • 6 Month: gained 2 bp
  • 2 Year: gained 21 bp
  • 5 Year: gained 63 bp
  • 10 Year: gained 67 bp
  • 30 Year: gained 67 bp


So the shorter end of the curve the Fed has managed to keep rates low but as you move further out on the curve rates have clearly moved up in the face of a monetary policy intended to keep rates low.  If you remember when Bernanke gave his 60 Minutes special he clearly says at 6:45 in the video – "What we are doing is lowering interest rates…"

Clearly QE in the eyes of the Fed is not working and they know that.  They have shifted the bar of success to equity performance but don't lose site of the Fed's failure to achieve a low interest rate environment for an extended period.  They have in fact lost control of the yield curve beyond one year.


  • Recently Fitch issued a report that 30% of commercial real estate that needs to be rolled in 2011 do not meet their standards.  


  • Residential mortgage is negatively impacted by rising 10 year yield. 


Regardless of what Bernanke may say publicly about the success of QE they understand its failures and they understand the extreme negative impact rising interest rates will have on future growth, bank balance sheet risk and credit formation.

Listen to Bernanke in the video below discuss employment.  He's very concerned and this was only two months ago.  Either QE is going to occur for the 4-5 years he says it will take for unemployment to come down to acceptable levels or the Fed will be looking for a way to save face while exiting future QE.  If this move in rates continues, the bond market may very well set future monetary policy and NOT the Fed.


Submitted by Ultra Trading.  If you would like to read more, please visit - Ultra Trading