Lihua Copper has just completed a consolidation across its channel, and is moving higher. It also triggered an Elders buy signal. worth a shot long for me.
Slope initially began as a blog, so this is where most of the website’s content resides. Here we have tens of thousands of posts dating back over a decade. These are listed in reverse chronological order. Click on any category icon below to see posts tagged with that particular subject, or click on a word in the category cloud on the right side of the screen for more specific choices.
Lihua Copper has just completed a consolidation across its channel, and is moving higher. It also triggered an Elders buy signal. worth a shot long for me.
In five business days, the insiders for MolyCorp are allowed to sell their shares to the public, and having a company with no near term earnings prospects, a pricing model controlled by your competitors, selling for over 6 times book value, and a stock that is 300% of the IPO price, if you were an insider hedge fund, or executive, would you sell?
Now that the fever has broken on this stock, I am expecting at least a move back to the bottom of the channel. I am short via Feb 55 puts, and I am also short REE Feb 16 puts. I acquired and completed my purchases last week. Why REE? Well when folks start bailing out of MolyCorp, they are going to bail out of the ETF for Rare Earths, and REE will fall in simpatico.
Enjoy, and join me on the wild side 🙂
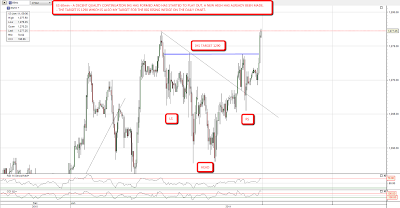
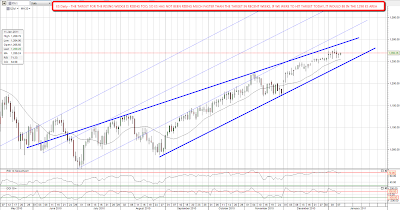
I'm seeing bullish breaks everywhere this morning, and I'm going to break my usual limit of five charts and post a sixth today. I was expressing serious doubts about the very short term bear case yesterday morning and my doubts were well founded. On ES an IHS has formed and has started to play out. The target is 1290, which is also my target for upper trendline of the big rising wedge on the daily chart:
The falling wedge on copper that I posted yesterday morning has broken up, and has already progressed too far for it to become a declining channel. The target is the previous high just below 450:

I mentioned yesterday that the falling wedge on oil had already broken up, and it is now most of the way to the target which is also the previous high just over 92.50:

What's really alarming me this morning though is what I'm seeing on forex. I've posted the falling wedge on GBPUSD in recent days, and that too has broken up. The target is the previous high at 1.63, though if it is evolving into a declining channel the target would be 1.59:

Many thanks to toad37 for pointing out the possible IHS forming on EURUSD yesterday morning. Since then a second alternative IHS has formed and both have broken up. The targets are 1.312 and 1.317 respectively and I've marked them both on the chart:

This is a bad place for a significant EURUSD low. I mentioned my analyst friend predicting an imminent major low for EURUSD in the 1.29 area the other day, and he could be right. Looking at the EURUSD daily chart I have a possible rising channel from the summer low, and very clear positive divergence on the daily RSI. If EURUSD has bottomed any looming equities correction is going to be fighting against a declining USD, which will be heavy going:
Oil prices pivoted off of key support at 87.25-86.80 last Friday in the aftermath of a decline from 92.58. Strength yesterday and today has the look and feel of a new upleg, which if accurate projects next to 94.60-95.20 — and, if that target zone is breached, onwards to 103-105. At this juncture, only a sudden downside reversal that breaks 87.25 will disrupt higher projections.
The move has benefited the US Oil Fund ETF (USO), as well as Petroleo Brasileiro (PBR), which we've been following. The daily chart on PBR shows the recent pullback from the Jan 3 high at 38.25 to the Jan 10 low at 35.89, which has the right look of a completed correction. Given today's strength, the chart has the look of a new upleg that should take out the prior high at 38.25 en route to still higher near-term target zones.
Originally published on MPTrader.com.
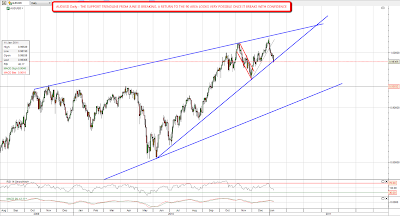
My feeling is that the top is probably in on copper and precious metals. I'm much less convinced that the same is the case on equities. ES has broken up through declining resistance from the recent high this morning, and that is adding to my feeling that equities aren't done yet. I've been expecting a hit of the upper trendline of my ES rising wedge on the daily chart, and unless we see ES 1250 broken then I'm still expecting to see that. That target trendline is rising as we chop around here and if we were to hit it today it would be just under 1290 ES:
We are seeing signs that a top is near though. I haven't posted the gold:silver daily chart in a while as it has been in a steep decline since August, with the ratio dropping by a third in that time. There has been a very clear resistance trendline for that move though, and that trendline has now been broken. That suggests that a major interim top may well be near:

In terms of a commodities top the commodity currencies that I watch, mainly AUDUSD and CADUSD have remained strong while USD has been rallying. There are serious cracks appearing in AUDUSD now however, with the support trendline from June now breaking. If that is broken with confidence then I would expect AUDUSD to fall towards longer term support in the 90 area:
I'm watching the falling wedge on copper this morning to see whether it will hold today. It may well not, as the equivalent falling wedge on oil is already breaking up. I'm not expecting a new high on copper or oil, but they could yet broaden out into declining channels or make double tops. If it breaks up I'll be expecting a further move up of some kind while equities make a new high:

One chart that really struck me as interesting as I was going through charts this morning was the chart for the Baltic Dry Index. I've drawn a very nice fan on the $BDI chart and on a break up that would look very likely to lead to a significant further move up. The chart looks very weak though and BDI is still some 87.5% below the peak in 2008. That might be due to a glut in shipping ordered near the top of the last bubble but it is very interesting regardless that it has been quite so weak:
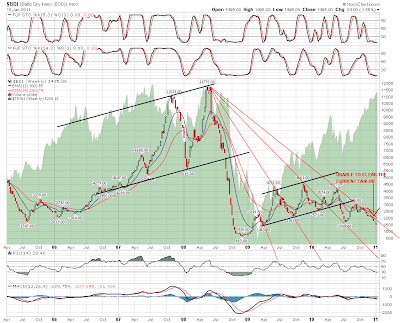
Sadly there is no BDI ETF. Does anyone know a decent way to trade the Baltic Dry Index?
