Slope of Hope Blog Posts

Slope initially began as a blog, so this is where most of the website’s content resides. Here we have tens of thousands of posts dating back over a decade. These are listed in reverse chronological order. Click on any category icon below to see posts tagged with that particular subject, or click on a word in the category cloud on the right side of the screen for more specific choices.

Down Move Not Finished Yet (by Springheel Jack)

By -

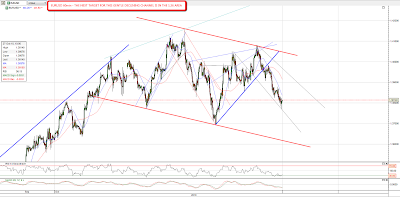
After yesterday's recovery and gap fill there was more more weakness on ES and EURUSD overnight. It seems likely that there is more downside coming because EURUSD is still well short of the channel target in the 1.36 area. I had drawn a trendline for a likely interim bounce from EURUSD overnight and so far it has bounced 55 pips from the hit there so I'm expecting EURUSD to bounce a bit more before the decline resumes. I'd normally expect to see a small declining channel on a move like this and if so, the short term target will be in the 1.39 area if hit today:

On the basis that the current EURUSD move doesn't look finished, I'm also expecting to see further weakness in ES this week, though with EURUSD bouncing in the very short term, it's possible we may not see much more downside today. On the ES 5min chart I'm looking for a bounce that could reach the 1182-4 area in the short term and then another move down, possibly towards 1167, to complete the head on a possible head and shoulders pattern:

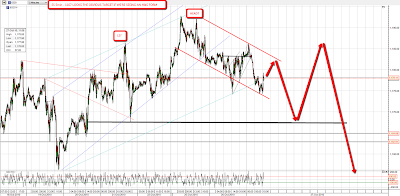
That 1167 target isn't quite as speculative as it might seem from the ES chart. A natural support level for a retracement is the SPX daily 20 SMA and that was at 1167 SPX at the close yesterday and is rising of course so it will be a little higher today and more so tomorrow so if we hit it tomorrow the ES and SPX targets will be close to each other. On the SPX 60min chart I'm seeing support for the current (green) rising channel in the 1175 SPX area and that is the minimum target that I'm expecting to see hit:

One thing that we've not been seeing on any weakness in recent days is a flight to treasuries. Just the opposite and it is very clear now that we're seeing a significant correction on long treasuries:

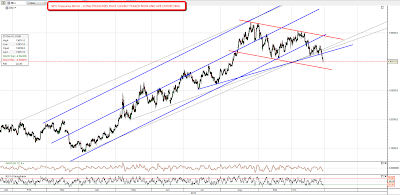
Why have treasuries not been boosted by any weakness in ES? Well bonds tend to trend down as equities trend up and equities really have been trending up for a couple of months now. I've been saying for months that any substantial QE2 push would be likely  to send bonds trending sideways to down while equities trend up and the direct effect of QE2 on bonds, if any, will be only to cushion any fall.

There's also the fact that the technical position for equities looks so strong here that people are viewing any dip as a buying opportunity rather than a cause for alarm. Even the bears are mostly just looking for a dip towards 1130 SPX here, and there's every reason to think that might happen, with USD having bounced off strong support and commodities looking ripe for a correction. I was looking at the CRB chart yesterday and it is looking very toppy. It has also tracked EURUSD closely over the last few months so a correction in EURUSD should deliver the same in commodities:

Interesting Steel Stocks (by BKudla)

By -

A couple of steel stocks caught my attention this weekend.  SID had a nice hammer on the lower band of the rising trendline with rising RSI. 

POSCO also is firming up along a similar trendline.  My final confirmation for either of these is a cross of 3/6 EMA.

The channels look large enough for a decent run.  Our stop area seems well defined along the lower trendline.

 Posco_10252010 

SID_10252010 

Posted by BKudla www.arum-geld-gold.blogspot.com

Chart on GLD (Mike Paulenoff)

By -

As our proxy for gold, let's have a look at the big picture of the SPDR Gold Shares ETF (NYSE: GLD). As we enter the final hour of the week, let's notice that the GLD appears to have held lows in the 128.80 area against its July-October up trendline, which preserves its near term uptrend. That said, however, the "Island (Cluster) Top" that was put in during the Oct 14-Oct 19 timeframe remains valid and represents a very powerful negative technical influence on the GLD.

Unless or until the gap area between 1.3150 and 1.3280 is filled, the near-term technical health of the GLD must be questioned. Furthermore, inability of the GLD to close the down-gap before the price structure breaks the July-Oct up trendline at 128.80/70 could have a devastating impact on the heretofore bullish trend- and will project GLD prices into the 123.00-121.00 target zone.

Much might depend on the outcome of the G-20 meeting, which likley will have a meaningful impact on the direction and the value of the US Dollar. If the Dollar responds positively to the G-20 meeting, then the GLD likely will break the July-Oct. trendline.

6X2iHobXx
Originally published on MPTrader.com.

Chart on Natural Gas (Mike Paulenoff)

By -

Let's notice that natural gas futures are in the midst of a potent recovery rally from yesterday's low at 3.395 to this morning's high at 3.593 so far (+5.9%). Meanwhile, the U.S. Natural Gas Fund ETF (NYSE: UNG) has climbed from 5.56 to 5.68, or +2.7% in the "draft" behind natural gas.

At this juncture, both price structures are poised to move considerably higher, but natural gas futures, in particular, are approaching a confrontation with their 3-month resistance line, now at 3.6330. If hurdled and sustained this should trigger follow-through strength in the UNG as well as it confronts its nearest term down trendline, now at 5.800. Of course, tomorrow morning at 10:30 am Eastern, natural gas inventories will be released, which likely will be impactful.

2bvBVzqTB
Originally published on MPTrader.com.

Chart on GLD (Mike Paulenoff, MPTrader)

By -

It is interesting that after the BAC-Fed-Pimco story came out, gold barely flinched. Shouldn't gold have been the beneficary of some flight to safety? Meanwhile, the DXY (Dollar Index) climbed from 77.85 to 78.20 on the news, suggesting that it was the "go-to" market in reaction to negative news about the banks.

Whether or not this reaction is a one-time event, we will have to see, but it is nonetheless something for us to keep in mind right now. The most meaningful feature of the enclosed daily chart of the SPDR Gold Shares (NYSE: GLD) is the cluster of days from Oct 13 to Oct 19 (today) which exhibit an "Island Cluster" downside reversal. This cluster of days started with a gap up and finished with today's gap down, leaving the cluster unattached and dangling by itself — a potentially very negative formation.

Inability of the GLD to claw higher to fill today's gap-down (133.00) in the hours immediately ahead will increase the likelihood of downside continuation to 128.40-126.25 next.

Q5qskYucy
Originally published on MPTrader.com.