Slope of Hope Blog Posts

Slope initially began as a blog, so this is where most of the website’s content resides. Here we have tens of thousands of posts dating back over a decade. These are listed in reverse chronological order. Click on any category icon below to see posts tagged with that particular subject, or click on a word in the category cloud on the right side of the screen for more specific choices.

Key Break Coming Soon (by Springheel Jack)

By -

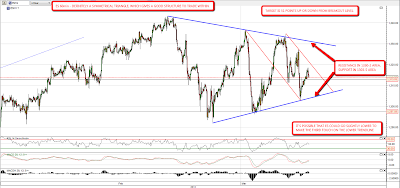
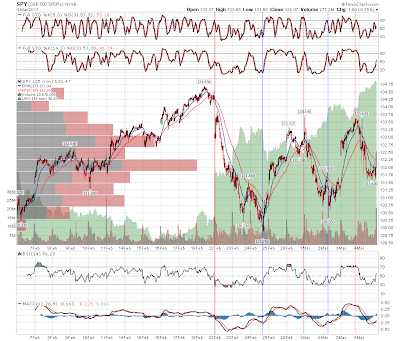
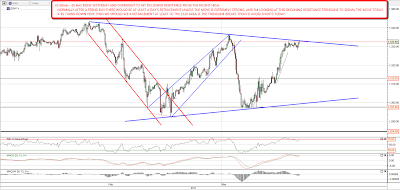
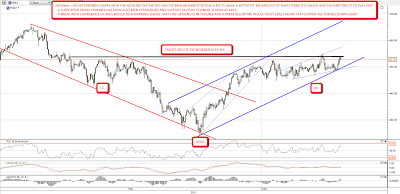
Mixed signals everywhere this morning, which fits the last couple of weeks really. On ES the upper trendline of the symmetrical triangle is at 1330 dead and a break of that level with confidence will give a pattern target of 1381, which is almost exactly at the 78.6% fib retracement of the bear market and a popular target for the end of the wave up since July last year. An IHS has formed that may get ES through triangle resistance:

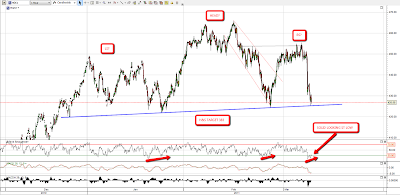
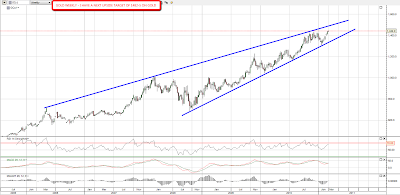
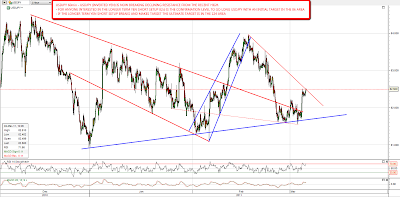
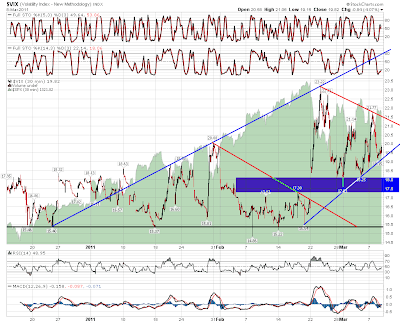
However I'll be surprised if ES breaks triangle resistance as the overall setup here still has me leaning bearish. NQ has been underperforming ES in this recent move up which is bearish, copper looks bearish, and Vix has been holding up which looks bearish. On the Vix a break below 19 is required to make the immediate bull case look more convincing, followed soon afterwards by a close of the open gap zone above 17.3:

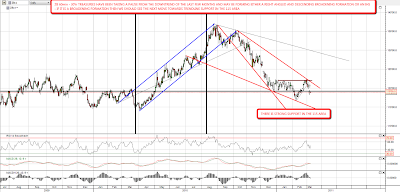
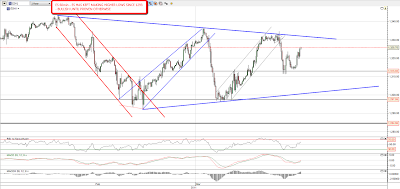
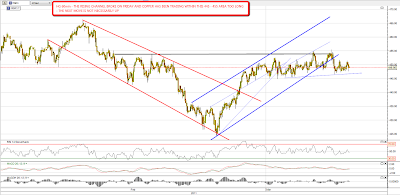
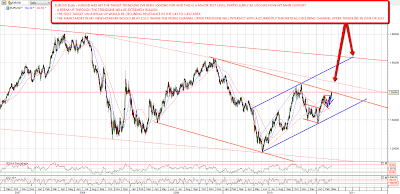
The big HS pattern on copper looks ominous for the equity bulls. We've seen the bounce from the neckline that I was expecting yesterday morning, but the overall setup looks bearish:

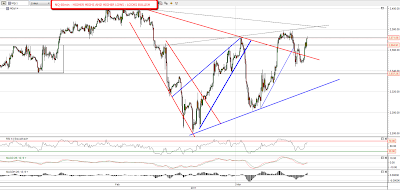
Short term there is a strong case for both bulls and bears on the copper chart. An IHS has formed, the neckline has broken and the neckline has been retested which looks promising for the bulls with an immediate target at broken support in the 445 area. On the bear side a rising wedge (70% bearish) has formed with a target at the main HS neckline just over 425. That could go either way, though a move back to 445 wouldn't necessarily suggest a break up on equities or invalidate the main HS pattern on copper. Here's the setup on the HG 15min chart:

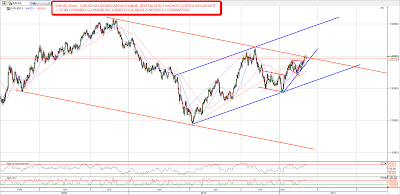
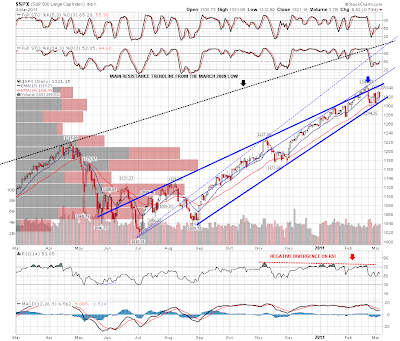
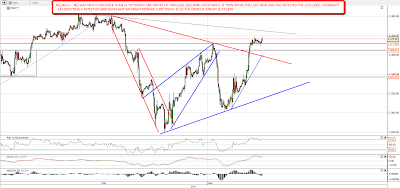
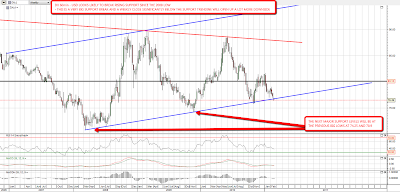
The transports index is looking stronger than most this week and I've been having a careful look at that this morning. Overall the chart for $TRAN is weaker than most and support from August has definitely been broken. A broadening top has formed, which is a neutral pattern despite the name, and the obvious next broadening top target is at a marginal new high, though first resistance has to be at broken rising channel support in the 5200 area:

Overall I'm leaning bearish on the overall setup, though the real test for ES is at 1330. A break above would be extremely bullish with a target at 1381, and a failure there would target triangle support at 1306-7. A failure at triangle support would be extremely bearish, though I'd wait for the break of 1300 for confirmation. A break downwards from the triangle would open up targets in the 1225 – 1260 area.

Chart on FCX, SLW, SLV & GLD (Paulenoff)

By -

My near-term work indicates that this morning's spike low in Freeport-McMoRan Copper & Gold (NYSE: FCX) at 48.61 followed by a sharp upside reversal above 50.00 (so far) has the right look of the end of the corrective process off of its Jan 12 high at 61.34.

If that proves to be the case, then FCX is about to enter a new upleg within its dominant uptrend off of the July 2010 low at 28.36.

Let's keep an eye out for a positive close today above 50.14. While FCX is attempting to put in a corrective near two-month low, the iShares Silver Trust (SLV), Silver Wheaton (SLW) and the SPDR Gold Shares (GLD) all are taking a breather in the aftermath of their near-vertical upmoves, which so far has not negatively impacted their otherwise very much intact and dominant uptrends.

Q95IhjIVI
Originally published on MPTrader.com.

Symmetrical Triangle on ES (by Springheel Jack)

By -

The picture has turned distinctly more bearish in the last day. Copper broke support at 445 and fell to support at 425, and made a fourth touch on a gently rising trendline there. A fourth touch on a trendline is often because that trendline is a neckline of course, and this could well be the neckline for an HS pattern. If so it would indicate to 383 on a neckline break. Positive divergence on RSI made a decent looking low on the 60min yesterday though, so I'd expect a bounce first:

EURUSD broke channel resistance, but hasn't held above it. A daily close above is needed to confirm that USD has broken support and to open up targets much higher for EUR:

SPX tested main rising support again yesterday and pinocchioed slightly through it at the low. This trendline has been visited a bit too often now and I'm increasingly concerned that support won't hold:

ES has now formed a nice symmetrical triangle on declining volume, though the touch yesterday was a little high and ES might return to touch 1301 today to make a better low. The next upside target is 1330-2 and the pattern top to bottom measures 51 points, which gives the target up or down from a breakout from the pattern. These patterns break up 54% of the time and the percentage meeting the price target is 66% on an upward breakout but only 48% on a downward breakout. Here's the link to the pattern stats at Bulkowski's Pattern Site:

Treasuries have been rallying in recent days and could be forming either of two patterns at the moment. The first pattern is an IHS with the neckline slightly over 122, but the right shoulder is looking too deep and treasuries haven't yet made the obvious downside target, which is strong support in the 115 area. The second pattern is a right angled and descending broadening formation, with the next downside target in the 115 area before either a break down from the pattern or return to 122 area resistance. These are a neutral pattern and can break out either way, though I'm looking for a break downwards to confirm the end of the 26 year declining channel on 30 year treasuries:

The likelihood of a downward breakout is considerably higher now, but the symmetrical triangle on ES gives shape to the current trading range. I'm wondering about an early move to triangle support at 1301 on ES, If that is broken with confidence then the pattern target is 1250. If if holds then the next upside target is 1330-2. As with yesterday, I'm watching copper closely for direction and a break with confidence of 425 support there would most likely also be followed by a break down on equities.

Cautiously Bullish (by Springheel Jack)

By -

Last week was very volatile, with trouble in the Middle East that is still unresolved, and everyone was waiting to see whether equities would make new lows, but they didn't, and as long as they don't the trend is still upward. Equities were moving roughly inversely to oil last week, but were stronger than a pure inverse correlation would require. Here's SPY vs USO on the 15min chart:

A new low wouldn't be required to show reach weakness on SPX however, and a break of trendline support would get us there. That support is in the 1308 area today

ES hasn't been making higher highs, but has been making higher lows. A triangle could be forming but the lower trendline has only had two touches:

Since the low NQ has been making higher highs and higher lows, and is now up almost 100 from the 2280 low. Given that the high was at 2403, that puts NQ within striking distance of new highs:

The overall picture remains somewhat ambiguous though. Copper looks weak, and has been hanging around in ther 245 to 255 area too long. The rising channel was broken on Friday and the IHS looks overcooked. A break below 245 on copper would look bearish for both copper and equities:

Silver made my 35.7 IHS target and gold has also made new highs. I have a possible rising wedge on gold with a target in the 482-5 area:

Overall the outlook looks cautiously bullish though the geopolitical risk still looks high. I'm watching copper particularly for a signal that equities might break down.

US Dollar Opens Death’s Door (by Springheel Jack)

By -

Equities gapped up and ran yesterday for the second trend day of the week. We'd normally expect to see a retracement for a day or two after a trend day unless the move is extremely powerful, but ES held the gains overnight so far, and I'm wondering whether we'll see that retracement today. I have a line in the sand on ES, as it has risen to declining resistance from the recent high, and it has held so far. Any move over 1334 would be a clear break up. The likely target of a retracement today if we do see one is the 1320 area:

NQ was much stronger than ES yesterday, and blew through declining resistance before breaking the last high in the 2370 area. Overnight it retested the 2370 level and like ES the overnight action is looking a lot like a bull flag. If we see a retracement I'd be looking at the 2340 area as the most likely target:

The copper IHS is still looking good, though I've been playing around with the neckline a bit as it's hard to pin down exactly. The retracement yesterday has confirmed a supportive rising channel and I'm expecting to see more upside. Immediate resistance is at 454 and the next rising channel target is in the 467 – 72 area depending on when it is reached. Channel support is at 449.5 and key support is at 445. A breach of 445 support with any confidence would badly damage the bull scenario:

For any of you following the longer term Yen short setup, I was saying that USDJPY (inverted Yen) had most likely bottomed the other day. It went a little lower subsequently but has now broken declining resistance at 82.5 (since I did the chart) which confirms the short term low. I have longer term declining resistance at 83.8, the main target is in the 86 area, and if the full Yen meltdown scenario plays out to target, the potential move is to 124. An alternative play on Yen for anyone wishing to avoid USD is to short JPY using another currency pair, long EURJPY for instance:

EURUSD made my upside target yesterday, and is now testing this extremely important level. The level is so important because USD is now testing rising support from the 2008 low. A break above will open up a lot more upside on EURUSD with more declining resistance at 1.43 to 1.432, but my main target would be a declining channel upper trendline in the 1.517 area, if it is hit in June or July. I've marked the rationale for this target on the chart:

The last chart today is the DX weekly chart to look at the US Dollar. I'm not optimistic about USD here, as the last bounce up looks like a dead cat bounce, and with the US effectively printing 70% of the huge deficit over the last two years the downward pressure is obviously strong. If it breaks down here then there is some support at the previous lows at 74.25 and 70.9, but USD will essentially be stepping into the unknown and it could go much lower. USD is still looking good next to the Yen, but that's a race between two currencies competing to have the worst fundamentals of any rich world currency. That Yen looks even worse is no compliment to USD. If USD falls hard here, there is also the clear risk that trading partners will move into using more stable currencies as a reserve currency, and that could turn this retreat into a rout on both USD and on US Treasuries. Anyone wanting to see the effect of a currency losing reserve currency status should take a look at GBPUSD between 1945 and 1980 to see what that looks like. Not a pretty picture:

I'm leaning towards seeing some retracement on equities today unless ES breaks up through declining resistance, but the underlying picture here will look bullish to me unless SPX breaks the main support trendline on SPX since July. That trendline is in the 1305 SPX area today.