Slope of Hope Blog Posts

Slope initially began as a blog, so this is where most of the website’s content resides. Here we have tens of thousands of posts dating back over a decade. These are listed in reverse chronological order. Click on any category icon below to see posts tagged with that particular subject, or click on a word in the category cloud on the right side of the screen for more specific choices.

Vix Buy Signal (by Springheel Jack)

By -

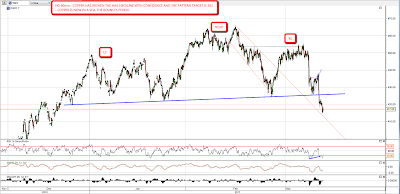
A Vix Buy Signal for equities triggered on Friday, after the Vix traded above the daily bollinger bands, then closed back inside, then fell the next day. We often see these at the start of big bull moves and they're fairly reliable bullish indicators, though as you can see from the chart below, they sometimes precede sharp dips, and the one triggered on the bounce just after the flash crash last year was not a buying opportunity:

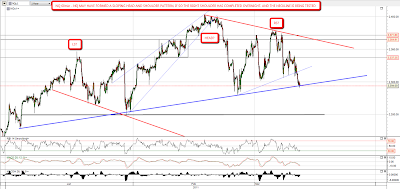
My ES and NQ targets aren't any different really from the ones I gave in Friday's post, and you can see those here. One thing I noticed over the weekend was that an IHS has formed on the SPX 15min chart, as well as a rising wedge. I'm not wild about the quality of the IHS though and am expecting one to form, if one does form, at one of the potential necklines further up:

We've seen a strong rise overnight, but I have mixed feelings about it. We're seeing some negative divergence on the ES & NQ 15min charts, and copper has not confirmed the rise so far. I'm still watching the IHS on copper that I charted on Friday and it hasn't broken up yet:

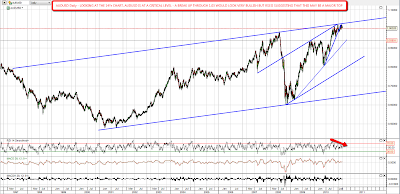
Oil's likely to be interesting this week, with civil war in Libya and trouble elsewhere in the Middle East still. We've put in a decent looking right shoulder on the IHS I posted on Friday and if oil breaks 104 with confidence 'll be looking for a new high at 110:

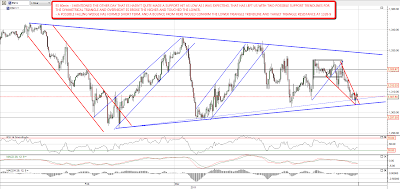
I've got a declining channel on silver that I'm watching with interest today. So far it has failed perfectly at channel resistance with negative divergence on the hourly RSI. If it fails to break up I'll be looking for a downside target in the 33.2 area:

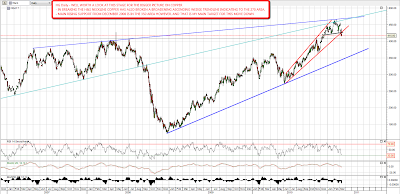
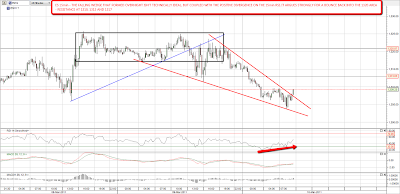
USD has broken support and I'm expecting more downside, and potentially a lot more downside. There is however one last declining resistance trendline that EURUSD must break through to reach my next target in the 1.47-8 area, and that is the main declining resistance trendline from the 2008 high. The trendline is unproven as it only has two touches so far, but a lot of people are watching this and resistance will be slightly over 1.42:

We're looking at a big gap up this morning, and obviously ES and NQ might just gap and go, though I'm not really seeing much evidence to support that so far. If ES and NQ break the overnight highs with confidence that will look bullish for today, and those are at 1291.25 and 2251.5 respectively. I'll also be watching the copper chart, but with copper at 431.5 at the time of writing, a break up before ES and NQ looks unlikely.

Gold & Silver Chart Analysis (by Mike Paulenoff)

By -

Although gold and silver have yet to show much, if any, upside volatility amidst the Japan crisis, the patterns carved out during the past several sessions strongly suggest corrections are ending and new uplegs about to emerge.

Given the uncertain and chaotic environment in the financial markets, this move could be powerfully higher — towards $1525 in gold and $40.00 in silver — against a backdrop of a rising euro/USD (falling US Dollar). 

UMqRgIUNN
Originally published on MPTrader.com.

Opex Week Begins (by Springheel Jack)

By -

Friday's powerful push up has prompted quite a few calls that the recent correction is over, and that's possible, though I think it's unlikely. We saw some major trendlines break last week, and I'm expecting to see more downside before another move up. That's not to say that equities will fall straight from here though. It's been quite a while since the bears saw anything resembling a free lunch, and with opex week beginning we may chop around a while before falling further. On the ES chart (June now), broken triangle resistance was tested hard on Friday and I'm seeing a perfect declining channel that suggests we may see more upside this week:

On NQ the 2300 level was briefly recaptured on Friday and a retest of the H&S neckline would be in the 2310 area. If that breaks up then a retest of declining resistance in the 2350 – 2360 area. As with Es it is the declining resistance trendline that looks important this week and I would see a break of that as a signal that the correction was probably over:

I'm watching copper carefully for a tell on direction this week. The H&S neckline was tested on Friday and a falling wedge has formed with resistance currently at 421. A break back up through that, and then a break over 425 for an hourly close would suggest a retest of the 450 level:

I've been looking very carefully at EURUSD this morning, as I thought there was a short term break down on Friday morning, but looking at it now it seem clear that EURUSD was just establishing the lower trendline of a short term declining channel. If last week's low is taken out then a significant retracement would be more than likely, but until then I'm not seeing anything bearish on the EURUSD chart:

Only four charts this morning as I'm having some trouble accessing my stockcharts account. I'm leaning bearish overall but thinking we may well chop sideways this week.

Dr Copper is Unwell (by Springheel Jack)

By -

I've been watching for a break of the big H&S neckline on copper and we got that yesterday with confidence. The pattern target is 383 and copper is now in sell the bounces mode:

Is 383 the real target for this move though? I'd say most likely not, as a look at the bigger picture on the daily chart shows that this H&S neckline break is also a break of a broadening ascending wedge indicating to the 270 area, after a failure at two longer term resistance trendlines. The main rising support trendline from December 2008 is now in the 350 area and that is the main target in my view. If 350 is broken then the next target would be 270 and that may also be the neckline on a very large H&S. The target for that would be 75, and I'd be extremely doubtful about that playing out. Targets are therefore 383, then 350, then 270, with support at 350 likely to hold in my view:

Is it possible that we've just seen a major top on copper? I've looked at AUDUSD to see whether there's any support for that on the AUD chart, and there is, as AUD is testing the upper trendline of a 14 year rising channel. A break through to 1.03 would look very bullish but the daily RSI isn't encouraging and there is a strong argument for a major top on AUDUSD here with targets in the 0.92, 0.8 and 0.68 areas depending on which support trendline holds:

So where does this leave equities? Well I'm definitely leaning strongly now towards a breakdown soon, but we won't necessarily see that today. ES made an interesting low overnight, as it bottomed at the original support trendline I had for the symmetrical triangle. I'm now inclined to see that low as the main hit at triangle support so the low at 1303.75 is now the line in the sand today for a break down from the triangle:

There is some reason to think that ES may bounce from support here, with the obvious target at triangle resistance in the 1328-9 area. A poorish quality falling wedge has formed since the highs yesterday and positive divergence on the 15min RSI is supporting a bounce. Resistance at 1310 has been tested twice since I capped this chart and a little IHS has formed. A break up through 1310 should open up 1320 as a target and if that is broken then I'd expect main triangle resistance at 1328/9 to be tested:

I've seen the forming sloping H&S on NQ posted several times in the last few days. I haven't been posting it myself because I don't much like it, as the neckline is a bit too mushy for my taste. Nonetheless it is a possible pattern and NQ has fallen to test the neckline overnight. If the neckline breaks with confidence I'd be looking for a move to 2250, where I have an alternative neckline for a larger H&S pattern.  The sloping H&S target is 2160:

As I've been finishing up I see ES has broken up through 1310 so I'm expecting any gap down to be filled today and my targets on ES are 1317 for the little IHS, 1320 as the falling wedge target and 1328/9 for main triangle resistance. Most likely this is just a bounce before a break down however and I'm expecting the ES symmetrical triangle to break down soon with a pattern target 51 points below the break level. Triangle resistance may well not be tested before that break down.