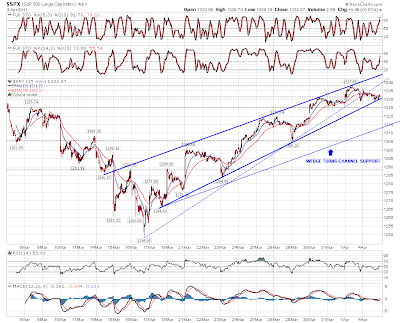
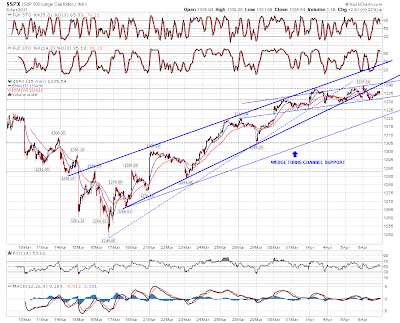
Equities have, on SPX and NDX at least, just been chopping around uncertainly this week. There are definitely some worrying signs of weakness on both SPX and NDX particularly. Here's the updated broken rising wedge on the SPX 15min:
Here's the updated broken rising wedge on the NDX 15min:
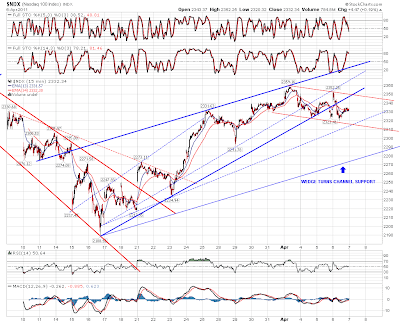
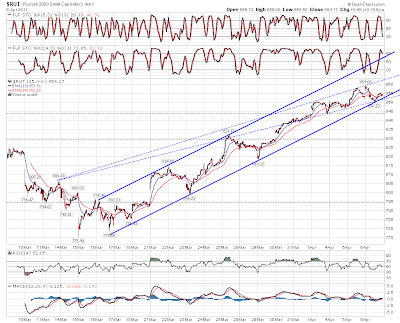
Both look potentially bearish, but I'm unconvinced. The Russell 2000 is still within a strong rising channel, though the latest touch of the lower trendline without an intervening touch of the top trendline is a possible warning signal. Here's how it looks on the RUT 15min:
Elsewhere though, there's little to suggest that we're seeing anything more than consolidation before another move up. My EEM vs SPX daily chart looks very solidly bullish:

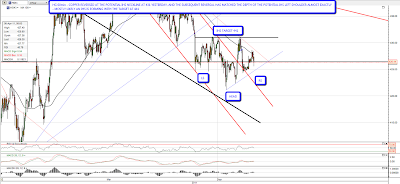
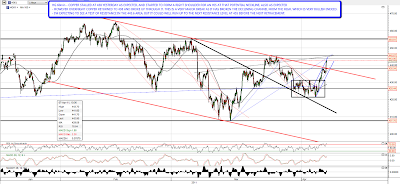
On copper my resistance target at 438 was made yesterday, and there was a reversal there to start forming what I was expecting to be the right shoulder on an IHS with the neckline at that very significant resistance level. Overnight however copper broke up and broke the 438 level with considerable confidence. That was a very significant break, as copper broke the big declining channel from the high that I posted last week. The next upside target is 445.6 but we may well not see a significant retracement until copper hits the next major resistance level (and potential IHS neckline) at 455. Either way this break up looks bullish for equities:
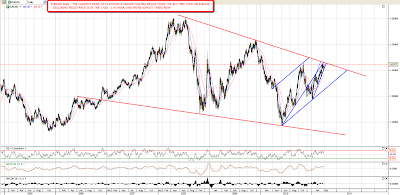
The resistance breaks with the widest implications this week however have been on EURUSD and gold. I posted the EURUSD resistance trendline in the 1.428 – 1.43 area yesterday morning and it was broken yesterday. EURUSD has returned to test the trendline overnight, and I'm waiting to see the weekly and monthly closes for full confirmation, but if sustained this break is very bearish for the US dollar, and has wide downstream implications for the bond markets and commodities particularly that I'm going to need to give some thought. Here's how that looks on the EURUSD weekly chart:

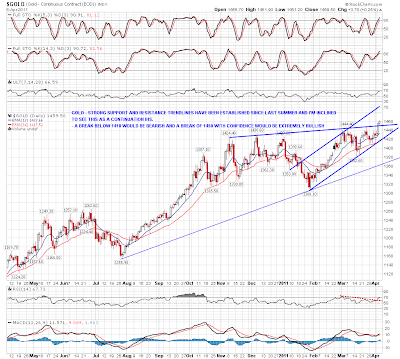
Reinforcing that resistance break on EURUSD is the big resistance break on gold. Looking at the daily chart the broken resistance trendline was retested yesterday, and more upside for gold looks very likely:
There's some scope for further weakness on equities this week I think, and if ES and NQ can break 1320 and 2315-20 then they could retrace back to the daily 20 SMAs in the 1300 and 2290 areas respectively. I'm doubtful about seeing any retracement that deep here though, and any further dip here should be bought in my view.