Hey Fellow Slopers,
This another post that might be a little basic for some of you, but a question came up recently about the differences between hedging with inverse ETFs and optimal puts, and since I know there are some self-described beginners among Slope lurkers, I thought it would be worth an elaboration here.
Inverse ETFs can be useful tools in hedging against market, sector, or industry risk, but there are a few reasons why investors may want to consider using optimal puts to provide downside protection for their portfolios (a quick reminder: optimal puts are the ones which will give you the exact level of protection you want at the lowest possible cost):
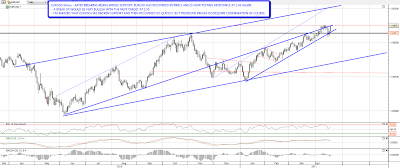
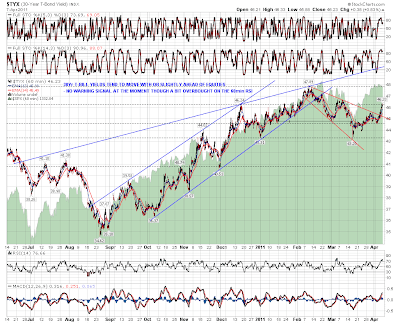
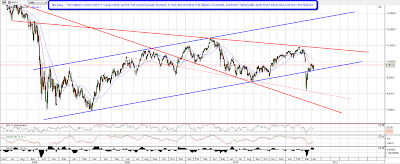
- Ability to hedge against idiosyncratic (or, stock-specific) risk. Say you own a particular stock and you are unwilling or unable to sell some of your stake in it to reduce your downside risk. If the stock has options traded on it, you may be able to use optimal puts to hedge against a decline due to an event specific to that stock. Inverse ETFs can be used to offset market risk or industry risk, but not stock-specific risk. For example, if you owned Toreador Resources Corp. (TRGL — a stock we mentioned in a post here last month,"Market Neutral: Short TRGL, Long IMO") at the beginning of the year, owning optimal puts on it could have limited your downside as TRGL declined since then, but owning shares of the ProShares Short Oil & Gas ETF (DDG) wouldn't have, as that inverse ETF has declined year-to-date as well, as the chart below shows.
- Precision. Say you own 824 shares of Exxon Mobil, and you'd like to know how to hedge that position against a greater-than-17% loss. Using Portfolio Armor (available as a web app and as an Apple iOS app), you could simply enter "XOM" in the symbol field, "824" in the number of shares field, and "17%" in the threshold field, and then Portfolio Armor would use its algorithm to scan for the optimal puts to give you that level of protection at the lowest cost.1
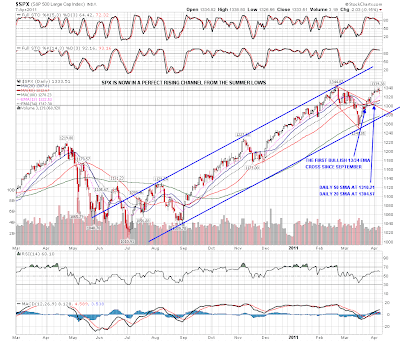
- Ability to cap cost at the outset. It's not always clear how investors who use inverse ETFs decide how much of their portfolios to allocate to them — I've asked Inverse ETF investors about this in the past, and in response have been told they "feel comfortable with" some small percentage. To use a round number here, let's say an investor decided to allocate 10% of his portfolio to an unleveraged, inverse index ETF, such as ProShares Short S&P 500 (SH), to provide him some downside protection against a market correction. What if the S&P 500 went on to stage a rally instead — what if it went up another 25% over the next several months? In that case, the investor's portfolio might be 2.5% lower than it would have been had he not purchased that downside protection. What if, instead, the investor bought the optimal puts to hedge against a greater-than-20% decline in the ETF that tracks the S&P 500, the SPDR S&P 500 (SPY)? As of Wednesday's close, the cost of those optimal puts was 0.86%; if the investor bought enough of those optimal puts to hedge his whole portfolio, their drag on his performance in the event of a 25% market rally would be capped at 0.86%.2
It's worth noting that, in that last case, part of the reason the optimal puts on SPY are so cheap is that volatility is still relatively low. The VIX volatility index closed Wednesday at 15.07, close to its 52-week low of 14.30 (its 52-week high was 48.2). Volatility can spike quite quickly though, so if you are considering hedging, you may want to consider doing so while volatility remains relatively low.
Disclosure: I am short TRGL.
1In that case, Portfolio Armor would round down the number of shares you entered to the nearest hundred (since one put option contract represents the right to sell one hundred shares of the underlying security), and then present you with eight of the put option contracts that would slightly over-hedge the 800 shares they cover, so that the total value of your 824 shares would be protected against a greater-than-17% loss.
2For the sake of simplicity there, I ignored the transaction fees of purchasing the ETF and the options, and I ignored the management fee of the ETF.