I've had a very hard time selecting charts to post this morning, as there are so many interesting charts that my initial selection for interesting candidates to post came to fourteen. I'll post an very unusually high number of seven charts this morning and put some of the others into a weekend post I'll post after the close tonight. My apologies to anyone who feels that seven charts in one post is too much to digest.
I wanted to say a few words on calling reversals this morning. Most traders call reversals regularly, and daytraders often call several on a single range trading day, but when an analyst calls a short term high nowadays, there tends to be a lot of dark muttering about calling the dangers of calling tops. There's an important distinction that needs to be made here, in that calling short term reversals is routine, and often highly profitable. It is calling major tops in a cyclical bull market that tends to end badly, though minor reversals sometimes have strong potential to turn into major reversals.
My point is that that I've called for significant short term reversals on SPX twice in the last three weeks. The first time was on Wednesday 19th January and we saw a decent retracement afterwards, and the second time was on Tuesday, and while we haven't seen a significant retracement yet, the market is currently lower than it was then, with no significant new high since, and every reason to think that it may go a bit lower before resuming an upward path. I've often called short term reversals in the past, and plan to do so often in the future. It's a fun game and, modesty apart, I'm often right. Anyone who wonders whether an analyst can really project reversals and targets with any accuracy should have a look at the ES chart I posted on 3rd August last year, in which I predicted the August reversal, and drew in the theoretical right shoulder of the potential IHS indicating to 1258 ES that we saw form and play out over the next six months. You can see that here. With the greatest respect to anyone who feels that buying the dip is the only strategy worth remembering, I'd point out that even to buy a dip, you have to select a likely entry, and in doing so, you are necessarily selecting a likely reversal area.
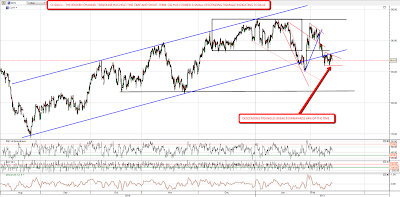
Does this minor reversal have the potential to turn into a major top? Absolutely, as any hit on the upper trendline of a big rising wedge has the potential to turn into a very major reversal, and I have several key charts that are flashing big red warning signs here, particularly on the EEM chart which has been a solid lead indicator chart over the last few years. It seems too long before the end of QE2 for a major high right here though, and I'd need to see some key support levels broken before I'd consider calling a significant top. I'd then need to see sustained weakness and some long term indicators turn red before I'd consider calling the end of the cyclical bull market. As some of these take six months or more to reverse, that won't be happening anytime soon. I'll post the EEM chart and some others that didn't make the cut today in a post this weekend.
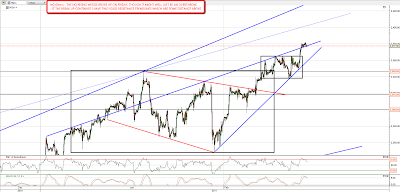
There is one other chart to post today that is worth considering in terms of a short term reversal here. Blogger jonny O mentioned something yesterday that was worth charting up and showing everyone. I'd noticed it before, but had forgotten that it extended back below the 1000 level, and it is that from the 800s to the 1200s there has been a significant reversal every time that we have first hit the 20s level (plus or minus 10), into the 80s level (plus or minus 10). We saw that once each in the early 800s through to the 1200s with the last being the major interim top last April, and since then we've since it twice more in the 1100s, and once in the 1200s. That is a powerful repeating pattern, with the proviso that the short term reversal has gone considerably deeper than the target area with the first 1200s reversal and the last two 1100s reversals. I've marked this up on my main SPX chart for this cyclical bull market:

Short term, ES is still reversing gently after the support break earlier this week, and I'm expecting to see some more of that in the next couple of trading days unless we see ES make a new high:

EURUSD didn't form the potential HS pattern I was wondering about yesterday, but is making good progress towards the wedge support trendline regardless. If that trendline is hit today it will be in the 1.347 area:

GBPUSD provides a good example of why I hate trading triangles today, as the triangle I posted on it yesterday had false breaks in both directions before resolving downwards. I'm expecting to see a hit on the triangle target at 1.585 and it might go lower:

Copper has now formed a slightly sloppy declining channel since the recent support trendline break, and it's possible, though I haven't marked it on the chart, that a continuation HS pattern is forming within that channel to take it into the 441 area:

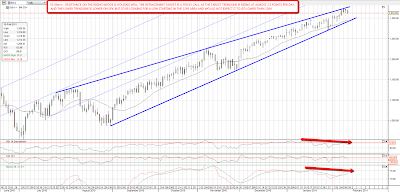
I was speculating about a possible break of the silver rising channel yesterday, and after a bounce yesterday that has happened overnight. I'm expecting to see some more downside on silver from here:

The lower support trendline on the broken rising channel on oil is now holding nicely as resistance, and a short term descending triangle has formed with a target at 84.10. Descending triangles have a 64% chance of breaking downwards, but in the larger context, and Egypt permitting, I'd put the odds of a downward break here considerably higher than that:
Of the short term charts that haven't made the cut today, AUDUSD has broken downwards as I predicted the other day and is now much of the way to my target in the 99.1-99.2 area and the ZB (30Yr Treasury) chart has now formed a full IHS indicating to the 119'25 area. I have a theoretical upper trendline for a short term declining channel slightly above there so I'll be interested to see whether that holds in the event the IHS breaks up. I'm still leaning sideways to down overall on equities today.


