Slope of Hope Blog Posts

Slope initially began as a blog, so this is where most of the website’s content resides. Here we have tens of thousands of posts dating back over a decade. These are listed in reverse chronological order. Click on any category icon below to see posts tagged with that particular subject, or click on a word in the category cloud on the right side of the screen for more specific choices.

Copper Breaks Up (by Springheel Jack)

By -

There's a bullish feel to everything this morning. Copper has broken the recent declining resistance trendline and may be forming a large IHS indicating to the 450 area. If it breaks through the neckline I have an immediate target just over 439 and a secondary target at declining resistance in the 444 area:

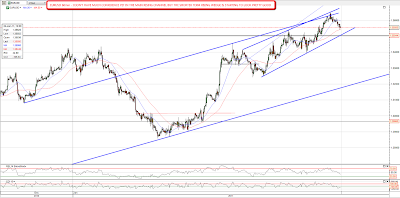
The big question today on equities of course is the GDP number and the reaction to it, and that's obviously hard to assess. Overnight action looks cautiously bullish on NQ however. The rectangle target at 2333 was made yesterday and NQ pulled back to support in the 2318 area overnight. That support held and if we see a strong move up on NQ from here, the remaining pattern target is on the (now huge) broadening top in the 2390-2400 area. NQ could make that target:

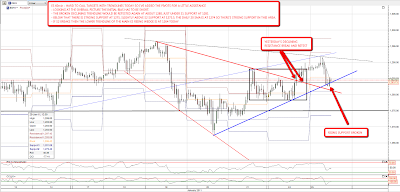
On ES there remains the possibility of a dip back to test support at 1286, and a break of that support would be bearish with the next immediate support at 1276. To reach it though would require a major technical breakdown, and I'll show why that is on the chart after this. ES is bumping around just under yesterday's resistance level but there's scope for a move today to the 1300 level and perhaps 1303 if we see a touch of the larger channel's upper trendline:

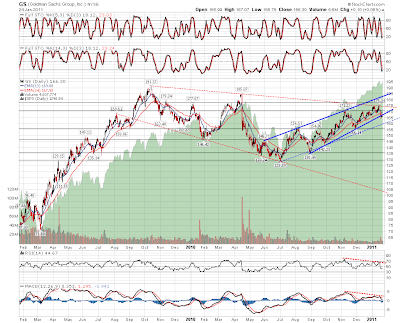
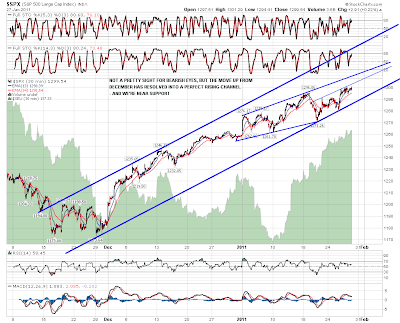
I was complaining in December that the rise on SPX from late November was shapeless and hard to pin down for targets. That's no longer the case, though the perfect rising channel that has formed on the SPX 30min chart will not be a welcome sight for bearish eyes. On the plus side we're not far above support and a break down through it would be very bearish. On the minus side the upside target looks to be in the (cough) 1350 area, though there are two decent resistance trendlines marked that should provide some resistance in the 1302 and 1310 area if hit today. The main rising wedge on the daily SPX chart has the upper trendline in the 1310 to 1315 area today:

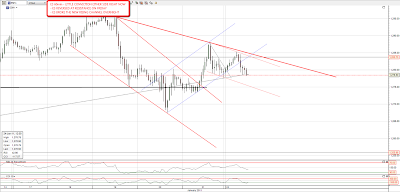
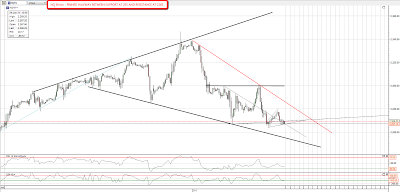
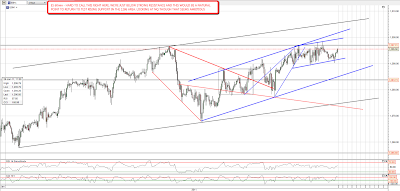
The most interesting chart this morning is definitely GBPUSD, where a textbook bear setup may be about to fail dramatically. The chart is simply beautiful and my commiserations to any GBPUSD shorts if this setup fails, though the odds are still that it will play out as you would expect:

Hard to say what the GDP figures will bring, but I'd be wary of shorting the picture I'm seeing this morning. There are still some signs of a top forming here, but the old adage that you should never short unless you see significant weakness comes to mind strongly here. Good advice though I'd add to it that a major trendline hit can also be a very good short entry. Unless we rise a lot, we're not going to see one of those today.

Eye on Precious Metal Names (by Paulenoff)

By -

This is shaping up to be a very important and a very interesting day for the precious metals and the mining names. With oil inventories putting pressure on U.S. oil prices in general, it remains to be seen if oil's impact presses other commodity prices lower — in particular, the precious metals.

If the mining issues remain bid, and buoyant today, then we could come to the conclusion that they are following the equity market lead, rather than the weakness in commodities. Right now, my technical work argues in favor of price stability followed by potent recovery rallies in Barrick Gold (ABX) and Silver Wheaton (SLW).

As for the commodities themselves, looking at the daily charts in the precious metal's ETFs from last night's close, a sustained up-day today will indicate that at the very least the corrective leg from the January 3 high at $30.44 in the iShares Silver Trust (SLV) and from the December 7 high at $139.81 in the SPDR Gold Shares (GLD) is over, and that a recovery rally period already is in progress.  With that said, it is imperative that Tuesday's lows at $26.03 and $129.07 remain intact and viable.

IR7A5vgLg Originally published on MPTrader.com.

Anyone for Calamari? (by Springheel Jack)

By -

Lots of charts today as it has been very interesting overnight. First though I saw a lovely chart yesterday which I thought I'd share with everyone and it is the daily chart for everyone's favorite vampire squid Goldman Sachs.

It's a beauty, a failure at long term resistance, a broken rising wedge and negative divergence on RSI and MACD. Furthermore there's a broadening descending wedge in red dotted red line that suggests that the next serious downswing may see GS break 100. Strong resistance is slightly below $175 so the risk/reward on the trade looks pretty good, and they may in any case rise with the market over the rest of the week to a better entry level:

Everyone knew what was going to happen next at the close yesterday at the high, after the breaks of declining resistance on ES and NQ, but the very bullish short term scenario didn't deliver overnight and looks unlikely to deliver today. The rot set in first with copper, which broke the strong recent (wedge) support trendline and then gave up most of the gains in recent days overnight. A break of 422 should take copper to 415 if we see that:

I stayed up late waiting for the NQ rectangle to break up so I could enter long with a target at 2331, but it didn't break up, and after pulling back significantly overnight the next obvious target is the rectangle bottom at 2267. Rectangles are (69%) bullish patterns so that support should hold:

On ES rising support from the low was broken overnight and the next obvious target is the second retest of yesterday's broken declining trendline. If that breaks then there is strong support in the 1273.5-5 area, and below that there is the lower trendline of the main daily rising wedge at 1264:

Oil fell overnight to hit my target at the lower trendline of the five month rising channel. It's showing some signs that it may break through it, in which case I'd expect a move below 85:

What was really interesting overnight though was that EURUSD broke the support trendline from 1.30. This opens the way for a serious retracement which could give the short side a strong edge today. EURUSD has been the despair of the shorts in recent days though and could trade around the broken trendline for a while:

GBPUSD also broke rising support overnight and crashed over 200 pips on the news that the latest GDP figures show that the UK economy contracted 0.5% in the last quarter. I've no idea why this should cause such a fuss as this seems a natural transition from the jobless recovery in the developed world, to the jobless and growthless recovery in the developed world. The UK has moved earlier than most in trying to restrain wild government spending to s(t)imulate growth, and others will follow in due course IMO, but in the meantime GBPUSD is building a bear flag and I'm expecting more weakness:

This might yet turn around, but the immediate picture looks bearish, and I'm expecting to see weakness today. If that develops momentum there is a significant risk of a trend down day.

Undecided (by Springheel Jack)

By -

There are some days when the market direction stands out strongly, and others when it really doesn't. So far this is one of the latter kind, with equities dithering between support and resistance without any conviction so far. On ES declining resistance is at 1285-6, and a break up through there would look very bullish, and there are support levels just below at 1278, 1274 and the 20 day SMA at 1272. A break of 1272 would look very bearish and would suggest a hit of the daily rising wedge support at 1262 ES:

NQ looks equally uninspiring, seemingly pinned halfway between declining resistance at 2285 and broadening top support at 1255:

There's a mixed picture elsewhere. EURUSD is still looking stronger than I expected, but recent action has formed a promising rising wedge:

Oil looks bullish with a hit of strong support but will turn bearish on an hourly close below 88.3:

Silver looks bearish with a test of broken support overnight and failure there:

The real question today is whether we have topped or are topping? That could still go either way. A break of declining resistance on ES and NQ would open the way to a new high or double-top, and a break below support on NQ would be a very strong signal that we have already topped.

A Prediction Fulfilling (by BKudla)

By -

Last March I wrote my first post for Tim and discussed what can stop the Fed.  At the time we were going through our second bout of uninterrupteded ramping in the market, and I speculated on what will kill the economy.  Please read here for the post

http://slopeofhope.com/2010/03/index.html

At the time the price of oil was $81, the price of gold $1130, and the interest rates were 3.7%.  In one short year, all of the levers that will kill the Fed's ability to strengthen the economy through more debt are now pushing hard against them, and are at breaking points for the economy. 


In addition, our inconvenience in these areas of price increases are turning into calamities overseas.  China and India are experiencing food inflation that, in my view cause world changing social unrest. South Korea is releasing emergency food stockpiles to ease pricing pressures, North Africa is experiencing regime change, and the other two BRIC countries, Brazil and Russia are suffering from these same hot money flows.  Oh, and don't forget Europe.  We are one bad harvest away from a worldwide upheaval (a post for another day)

All of this calamity because the TPTB are protecting the bank and other fixed income bondholders.  All of the extra money created worldwide is being used to buy hard assets (and being hoarded) with the fake money, and the money is being politically directed.  So in the end, the imbalances continue until the masses here in the U.S. can't absorb the costs anymore.  That time has come; as I always contend, the price of energy is the silver nail into the Fed.  Food and transport companies are getting crushed via margin pressure, and they will release that pressure onto us.  As that happens (already begun) the political heat ends the games and the long awaited debt destruction spiral can and will begin.

My bias is that we profit correct out of this quarter, the politicians panic regarding the Muni crisis, and we move into our last bout of the bubble, then it gets ugly.

Enjoy your weekend  :-), and go Steelers.