What got me checking into the SEMI data is a goofy MarketWatch article featuring a fund manager who owns the FAANG type stocks at 30 multiples, but has found relative value in AMAT and LRCX, the two Semiconductor Equipment stocks that I was bullish on 1.5 years ago. I know, I know… I sold too soon and that is my issue and I have to own it. But the point is that it was hard to buy then, unlike now.
 (more…)
Slope of Hope Blog Posts
Slope initially began as a blog, so this is where most of the website’s content resides. Here we have tens of thousands of posts dating back over a decade. These are listed in reverse chronological order. Click on any category icon below to see posts tagged with that particular subject, or click on a word in the category cloud on the right side of the screen for more specific choices.
The Cycle of the Small Caps
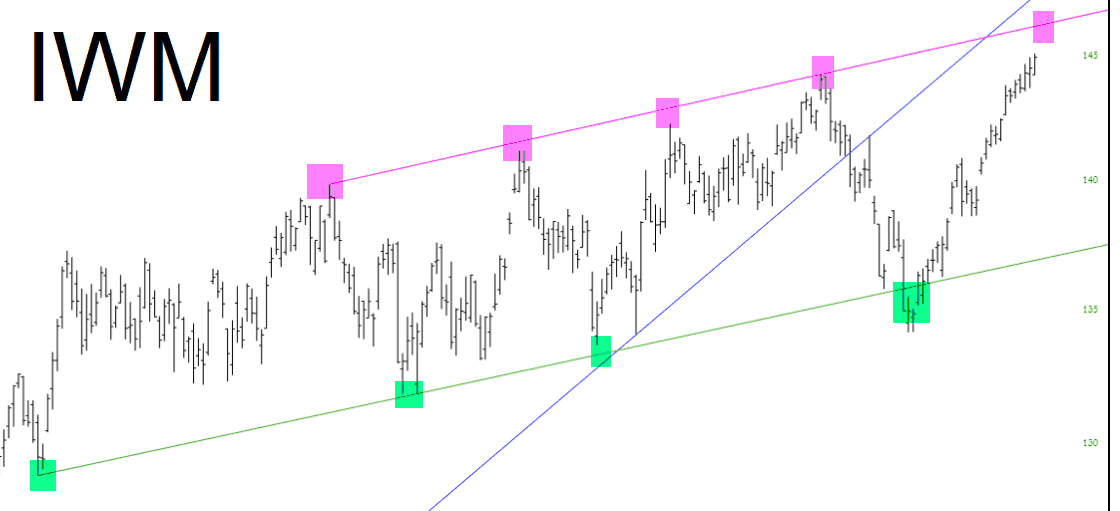
Seven
I was rather intrigued at the chart below, published over on John McClellan’s site. I can practically hear the snare drum in the background as we approach autumn.
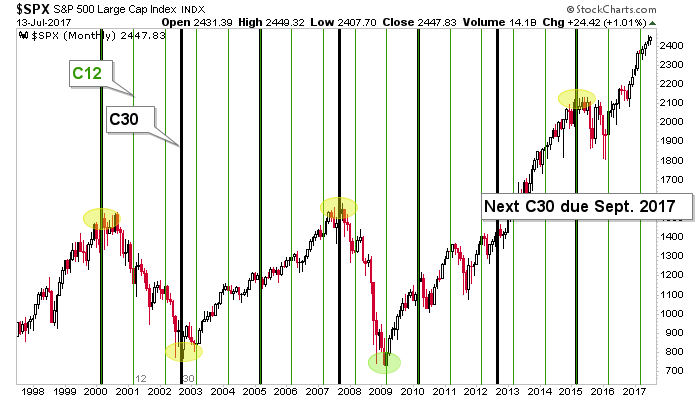
SPX Cycles, Fed Funds and Gold
This “amateur cyclist’s” chart (I am anything but a cycles analyst) of the S&P 500 shows that the 12 month marker (C12) meant exactly nothing as the market remained firmly on trend, after brief pokes down in April and May. We noted that C12 was a lesser indicator than the 30 month cycle, which has coincided with some pretty significant changes (+/- a few months). That cycle (C30) is coming due at the end of the summer. Will it mean anything? Well, this market eats top callers for breakfast, lunch, dinner and midnight snacks. But it is worth knowing about to a lucid and well-armed market participant.
Judas Oilscariot
Well, oil’s explosive rally recently has been a thorn in my side (although the NASDAQ’s weakness has helped balance it out). I wanted to take a look at recently counter-trend rallies in oil and see if there might be any insights to be drawn. I have one……….
It seems to me, looking at recent history, that these idiotic, wrong-headed rallies last for thirteen days before reversing. Now I realize a sample set of two isn’t exactly mind-blowing, but what else ya gonna do? Just take a wild guess? Thus, if this pattern holds, oil has the rest of this week to keep pushing higher before it finally rolls over yet again.
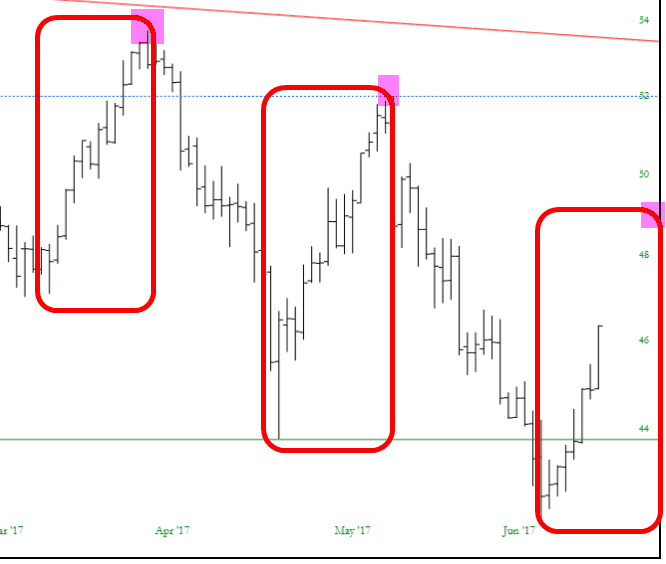
One thing to note about the chart above……it does NOT include today’s action (which is another big up bar). I love SlopeCharts, but one limitation is that futures data is end-of-day only at this point, so I wanted to be really clear that one “day” is not present in what you see above.
