Slope of Hope Blog Posts
Slope initially began as a blog, so this is where most of the website’s content resides. Here we have tens of thousands of posts dating back over a decade. These are listed in reverse chronological order. Click on any category icon below to see posts tagged with that particular subject, or click on a word in the category cloud on the right side of the screen for more specific choices.
SPX 30 & 12 Month Cycles
- With the disclaimer being that as an intuitive and more artful TA using inter-market ratio measuring tools and the like, I am the furthest thing from an accomplished cycles analyst. Indeed, I am probably less adept at it than you are.
That behind us, I was fooling around with Stockcharts.com’s cycles tool and came up with this monthly view of the S&P 500, with the thick black lines being a 30 month cycle and the thin green lines being a 12 month cycle, each starting from the 2000 market top.
Each cycle has caught some pretty significant turning points with the 30 mo. having caught the 2000 and 2007 tops along with the 2002 bottom and the pre-corrective 2015 top. The 12 mo. cycle seems to have been more adept at spotting interim turning points but it did catch the 2009 bottom.
14 Trading Days Left
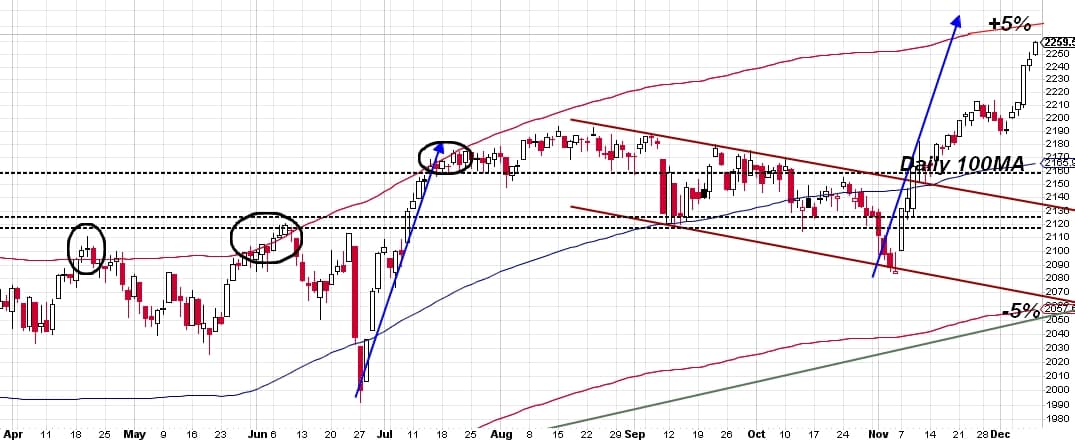
So as I’m sure everyone noticed, price sped up a bit this past week. It might have taken some of us (including myself) by surprise, but in the bigger picture, ever since Nov 9th kicked this rally into full gear, price has been fairly relentless ever since. Just take a look at the 100MA deviation envelopes.
This is a Warren Buffett Market
 The day after the Trump election victory, articles came out on describing how much Buffett made – some $11B, according to this CNBC article published on November 22, 2016.
Thought that was a lot and that it might’ve been too late to buy then?
Well, wait til you hear about how much Buffett made after this past week’s rally. Just look at the size of that December rally compared with the election rally in November in the chart below.
Testing Support and AAPL Revisited
I wasn’t planning a post here today but I have more time than I expected this morning, and I didn’t manage to do the AAPL post I was planning yesterday, so I’m going to combine them both into a single post here this morning.
I’m rolling into the December contract over the weekend, so if you’ve rolled already then I’ve put the spread between the September and December contracts on each of the ES, NQ & TF charts below. All three charts were done and posted last night for subscribers at theartofchart.net.
At the time of writing all the key support levels that I was looking for at the time I did these charts are being tested. ES has made the 61.8% fib retrace and is testing the monthly pivot at 2168 (2161.5 on ES Dec). NQ has made the double double target at 4783, and is now testing the monthly pivot at 4763 (4759 on NQ Dec). TF has made the obvious 38.2% fib retrace at 1249/50 (1245 on TF Dec). These are big support levels, and given the timing on the cycle windows I’m expecting a reversal back up to new highs here.
