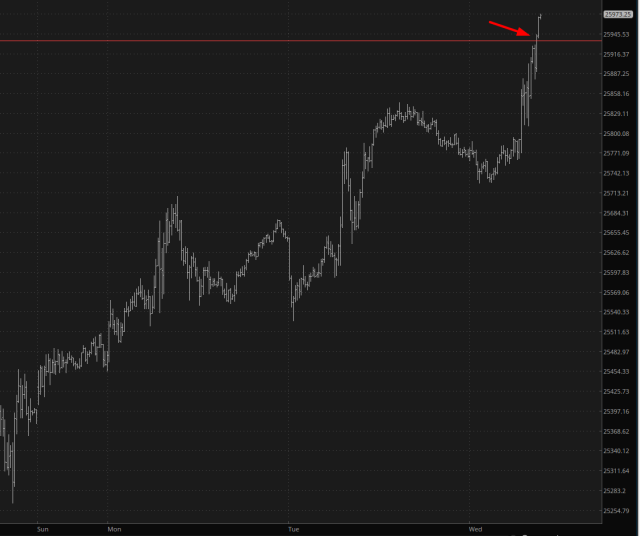
For all four trading days of 2026, the NASDAQ has lurched higher. This morning, the /NQ cut above one of the resistance levels I had laid down.
Slope initially began as a blog, so this is where most of the website’s content resides. Here we have tens of thousands of posts dating back over a decade. These are listed in reverse chronological order. Click on any category icon below to see posts tagged with that particular subject, or click on a word in the category cloud on the right side of the screen for more specific choices.
For all four trading days of 2026, the NASDAQ has lurched higher. This morning, the /NQ cut above one of the resistance levels I had laid down.
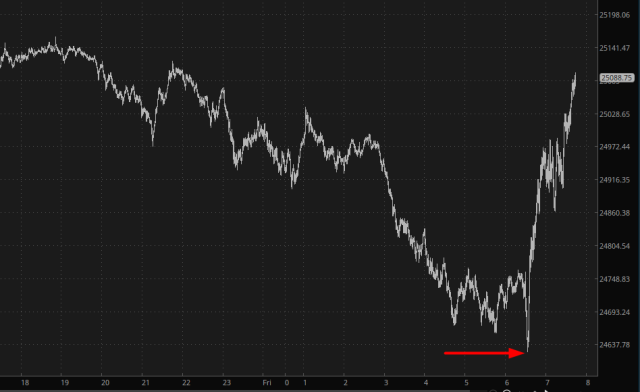
What a surprise. A “V” bottom just moments after the markets opened. The markets have changed from crashing to all-green. Disgusting!
I truly enjoy writing (said the man unnecessarily who started getting published at age 15 and has written twenty-five books, including a 568-page novel, a full-length screenplay, and 50,000 blog posts). But I gotta tell ya, it’s getting increasingly difficult to write about this so-called “market”. There are only so many things a person can say about lifetime highs. “Wow. Goodness. Gosh, it’s even MORE over-valued! How about that?” It gets old.
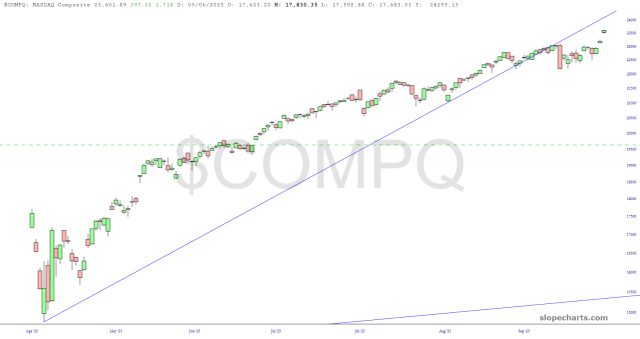
In that vein, every single index chart looks identical: that is to say (i) a long ascending trendline anchored to April 7th; (ii) a failure; (iii) nearly daily higher closes, typically representing new lifetime highs; (iv) all the while getting closer and closer to the underside of the broken trendline, which now represents resistance.
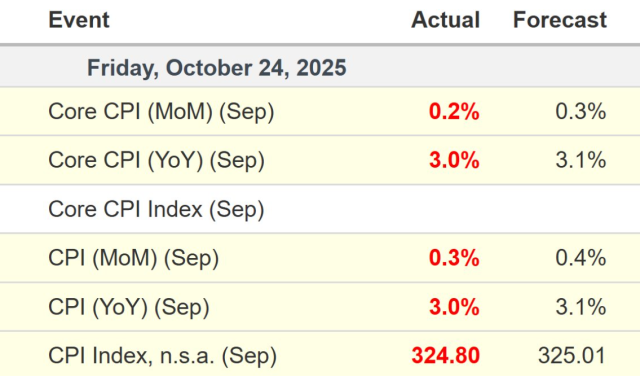
As we approach a full month of the government being shut down, we find ourselves living in a data desert. A rare exception came this morning in the form of the Consumer Price Index, which was a little lower than expectations.