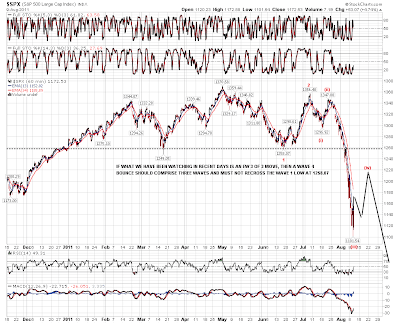
From the March 09' low we are now 618 days into the future and 618 is a key number (.618% or 1.618%). Breaking it down further on the weekly chart we have 127 bars up from the same low and 127 is also a very important number 1.270%.
On the weekly there has been 888 days from the low. So if you take 888 and divide it by 127 you will get 6.99. Take that and square root it a few times and you will get to what? 127 and 127 is how many bars we have had up on the weekly so there is a cluster there on the 127 ratio.
If you break down to the daily chart we have had 618 bars up on 894 days. Also on the daily chart the TR or the Time Retrace is .01274. Notice how on the daily we get a time retrace of .01274 which is very close to the weekly chart numbers of 1.270. Also on the daily we have 7.8517 Ppb (points per bar). Take 7.8517 and divide by 618 and you get .0127 again!
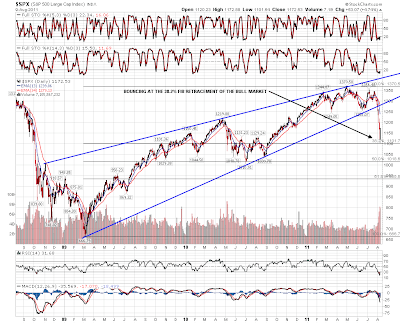
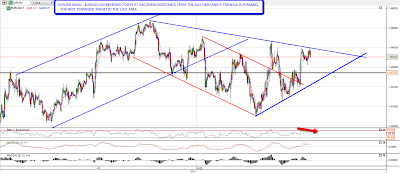
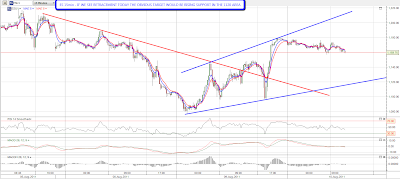
All of these numbers came where? On the move down to symmetry support and we noted the levels ahead of time and none of the markets have closed below the support numbers. In fact, we had a 800 point bounce from the support levels.
We are not saying that the low holds 100% because who really knows for sure but there is a calculation here that we went over so you can do with it what you want. Going back on every major turning point there has been both time and price relevance.
Some people believe and some do not and we are not here to try to convince anyone of anything but we hope you can find some value along the way and apply it to your trading.
Happy Trading,
www.eMiniSchool.com
http://wwweminischool.wordpress.com/
PS. We do have short term resistance from the last high on the 60 minute chart in both time and price as well but it is only 40% so it is not that great but it could get us back down to the 11,000.