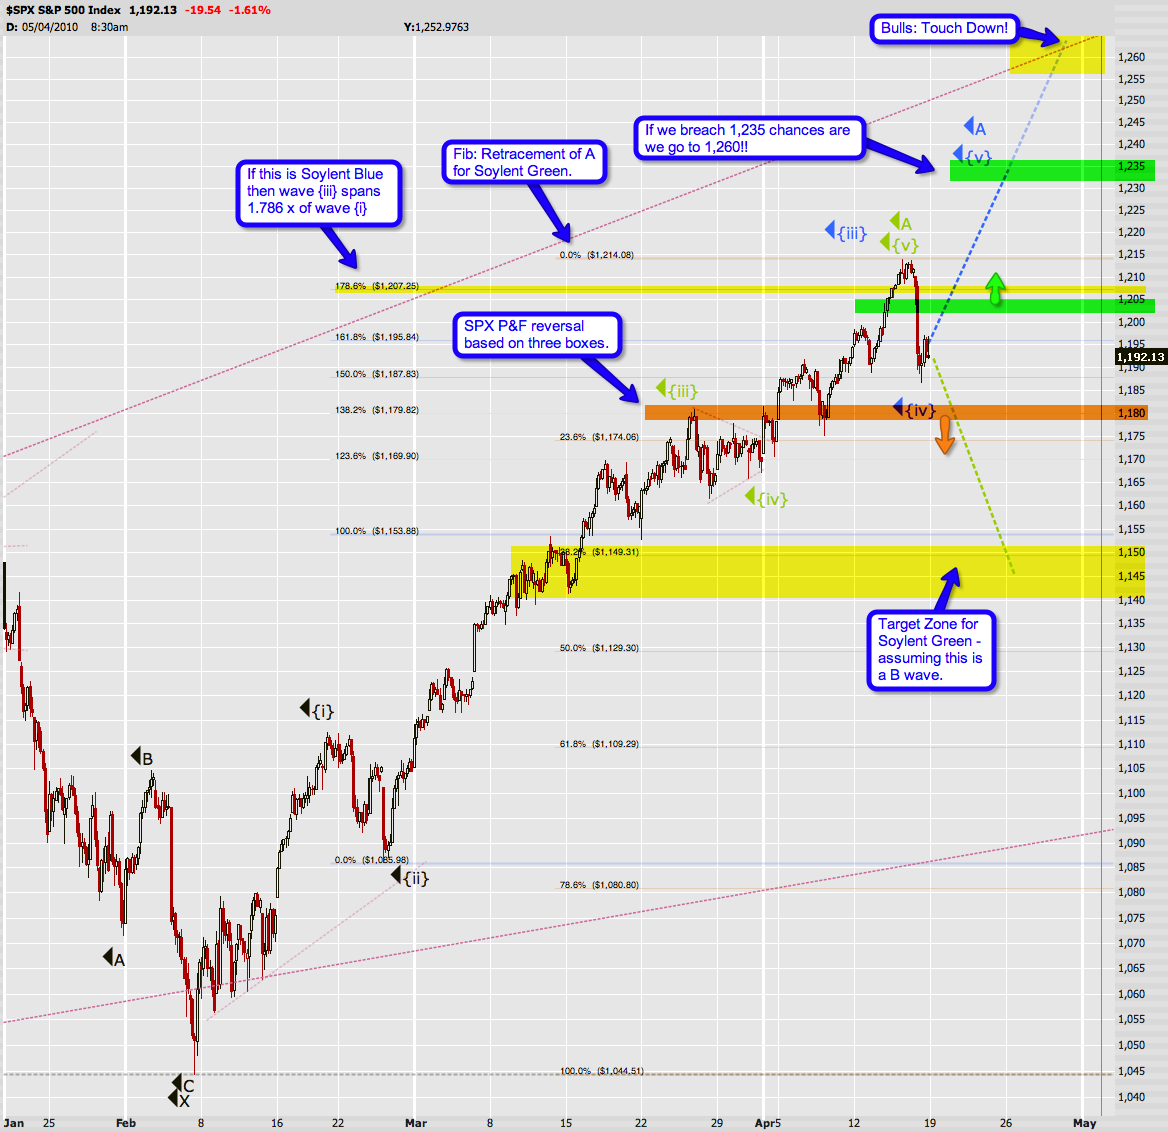
Slope of Hope Blog Posts

Slope initially began as a blog, so this is where most of the website’s content resides. Here we have tens of thousands of posts dating back over a decade. These are listed in reverse chronological order. Click on any category icon below to see posts tagged with that particular subject, or click on a word in the category cloud on the right side of the screen for more specific choices.

Mole’s Quick And Mostly Dirty Weekly Forecast

By -

<shameless plug>The following was available to Evil Speculator subscribers over the weekend. Unlike other subscription blogs Evil Speculator has been shifted towards a hybrid system in which important analysis and trade ideas (i.e. symbols, setups, etc.) are available to subscribers first but are later opened to a general audience. If you are 'evil speculator curious' drop by for a visit anytime – we're up to no good on a constant basis.</shameless plug>

Alright, let's dig right in:

We are thinking long term here. This is my radioactive fusion
powered 5-day MA Copper/SPX chart. The MA is on the Copper futures and
what we are looking for are long term divergences. Yes, long
term – the short term is way too noisy for me to attach any
interpretations. Quite salient is the ‘mother of all bullish
divergences’ in March of 2009. Wish I would have seen this one back
then as it would have helped in assessing the timing of the finale of
the trend.

But wait – there is more. Let’s project forward a little and
consider what ‘may’ happen if we get something that may look like the
onset of Primary wave {3}. After the first major drop we would a see
snap back into Intermediate (2) – which should not be confirmed by the copper futures.
Remember – we are looking for divergences in the scope of Primary or at
least Intermediate degree moves. Anyway, it’s a good theory – for now –
let’s keep an eye out and put it into context along with some of the
other charts I’m peddling here.

That’s this week’s shock and awe chart – I’m shocked that
the CPCE’s 10-day SMA did not budge after Friday’s drop. My take – the
bulls see this as nothing but yet another dip buying opportunity. Well
– we shall see shortly.

During Friday’s session got dangerously close to busting outside the
upper border of the 2.0 BB on Mr. VIX. Fortunately we did close inside
– meaning no buy signal (yet). Doesn’t mean we won’t get one though –
IMNSHO we might see a repeat of what happened late January.

I’m no P&F pro but that upper trendline I pointed out last week
seems to have served as resistance – thus far. If we get a drop to
1,180 on the S&P 500 cash index this chart would show a first
circle as a possible beginning of a downtrend. Not sure if that is a
‘confirmation’ of a reversal but it does count and becomes part of the
chart, so let’s just go with that unless we hear otherwise from a
P&F pro. I have highlighted the 1,180 mark on my wave count below
as well:

2010-04-18_SPX_count

You might want to open this one in a separate window/tab by clicking
on it – it’s got quite a lot of detail. I won’t repeat all my comments
here but suffice to say that I have a feeling that things are slowly
shifting back into focus now. The retracements all line up quite nicely
and we might just have ourselves a map here.

Soylent Blue means that we are either done with Minute {iv} or will
be by around 1,180 – that P&F reversal point I highlighted above. I
postulate that we may bounce a bit before that and keep it off the
P&F chart – but that’s just a theory. If we keep dropping through
that point Soylent Green becomes a lot more realistic. The target for
Green is the 1,145 cluster as we are near a respectable fib lines, i.e.
38.2% on the way down and 100% of {i} on the way up. That’s right – I’m
the tamer of ferocious fib lines – Siegfried & Roy have nothing on
me ;-)

Some other comments on the chart – I think it’s a decent map – keep it handy as next week unfolds.

Cheers!

Mole

Have we just seen the wave 5 top on SPX? (by Springheel Jack)

By -

I've been looking at SPX this morning and the evidence that we may just
have seen the end of wave 5 of 5 looks compelling. If so we have just
made a major top. Let's consider the evidence.

Firstly I was
looking at ES this morning and I see that a possible H&S pattern is
forming with the right shoulder on that pattern developing now. Looking
further at it and dropping my preconception that a rising channel is
forming I now see that recent action fits much better with a rising
wedge:

100416 ES 60min Wedge and HS Pattern

Now
I am fairly convinced that we are in wave 5 of 5 up from the low in
March 2009 here, though we may instead be looking at a wave 3 extension
for the bearish interpretation. What we are looking at here is a
textbook wave 5 termination pattern and I have an example from EWI of
one here for comparison:

100416 EWI Ending Diagonal Rising Wedge

Looking
at the SPX chart for the wave 5 of 5 up since the Feb 5th low, I have
marked in the wave count for what I think now looks like the highest
probability count unless we make a new high today:

100416 SPX 60min Wave 5 Channel

To
add further weight to this scenario, jacksoo pointed out this morning
that we hit significant resistance yesterday on a line drawn from the
November ES high:

100416_ES_Daily_Trendlines_and_Patterns

This
all adds up to a compelling scenario that this wave top may well now be
in. There is still some room for upside in the rising wedge of course,
and there is also a little wiggle room on the resistance trendline from
the November high, depending on how it is drawn, but not much. If that
H&S finishes forming today then I think that it will signal an
excellent short on a break of the neckline at 1201.5 ES, at which stage
the rising wedge will also be at breaking point. If the lower trendline
of that rising wedge, currently at 1203 ES, is broken on an hourly
basis, then that will also be a signal to position short.

If the
wave top is in, then we should now at minimum now see an abc retracement
that should take SPX back below 1100. If the move since March 2009 has
been a rally rather than a cyclical bull market though, then the top may
be in, and we could then be starting a move towards a new low.

One
caveat of course is that wave 5's can extend too. As ever in this
strange market, some caution is required. Good trading everyone!

Elliott Wave Principle Thoughts (by Nathaniel Goodwin)

By -

At great risk of being
cyberbullied here on this site, I thought I would share some of my thoughts on
EWP.

When I use EWP, I really only apply it to the indexes on a larger
time frame, usually daily or weekly charts. Sometimes it works well for me on
individual stocks on a much shorter time frame; but with that said, I feel that
waves are sometimes manipulated on short time frames 1-5 min charts. Motive
waves morph into a complex corrective patterns frustrating day traders using
EWP. It would kill me if I relied on it solely, I need other tools to show me
if the stock is overbought/oversold or signs of divergence.

I have spent many hours studying EWP and NeoWave,
many more hours than the average adult male of my age. It sort of disgusts my
mom, she always wanted me to go enjoy the outdoors with friends or maybe find
some sort of female woman to make babies with so the Goodwin name would live
on. Instead I wasted my time counting waves like some loser douche bag in my
bedroom (that's what she said-my mom).

I don't subscribe to EWI, NeoWave or any other subscription site
(I do have a good idea of what their counts are though). I don't really visit
many Elliott Wave blogs (some of those are great when one is trying to learn
EWP, but I would never use them for real trading). I also do not pay much
attention to any count I see on less than a daily time frame; I get lost in the
squiggles, see many errors and lose focus on the big picture. One of the
biggest problems I see with Elliott Wave is that when everyone is looking for
the same wave count, that count is quickly invalidated; which is one reason
Glenn Neely came up with NeoWave – an evolution of traditional Elliott Wave. He
claims that Elliott Wave/patterns have and will continue to change as more
people use it.

Learning how to use EWP and having confidence in my own counting
is what I strive for, not saying my count is right or that count is right. The STU updates over at EWI has had about as much success as my own counting over the
past year, maybe a little less. I always keep several counts, bullish, bearish
and neutral. When one gets invalidated, I remove that count and go on from
there. Nobody knows what is going to happen tomorrow or next week/month, I feel
that one needs to be very flexible and quick to change their mind if they want
to practice EWP. It has cost me greatly to be too stubborn with a certain
count, and there have been times when I totally scrap EWP for months at a time
while the market does whatever, then revisit EWP to see if something is making
sense.

Here is an example of one of my counts, one of six right now. It
is very flexible and not necessarily looking for P2 to end and the devastating
P3 to begin, although that is certainly possible. Moving around the larger
ABC's or changing a couple of the larger ABC's to 123's, one might see that
this sort of count could change to very bullish or become neutral depending on how we
proceed from here in the next few weeks or months.

SPX
 

Look, I really believe a monkey can count waves. The tricky part for
me is how fast I can/am willing to accept changes in my wave count, or
accepting that I'm wrong all together. I don't get pissed off of at some blogger or that STU guy at EWI, learning how and gaining the confidence to do it myself is what I
strive for. If I can't do that, I scrap it for a bit and use other tools until
the waves start making sense again.

Flame on.

USD Retracement Will Push Equities Up (by Springheel Jack)

By -

My last post was on how the USD uptrend still looked intact despite the
sharp pullback into Wednesday's close. That remaining the case though
was dependent on USD reversing back upwards on Thursday which most
definitely failed to happen. The USD rising channel is not yet broken,
but there is now every reason to think that this USD wave up since
December peaked at 82.24:

100404 USD Daily Rally Channel

GBPUSD has broken up decisively on Thursday and EURUSD now looks poised
to do the same. They may yet turn back down, but that looks less likely
than a further move up.

In the context of the longer term, we are likely to have been watching
only the first wave (of 5 waves) of the third wave up since USD bottomed
at 70.7 in 2008. We should now see a significant retracement of the
wave up since December before the 3 of 3 starts and a much larger and
longer move up in USD begins. I have marked likely retracement targets
on the daily USD chart above. Here also is a look at the monthly USD
chart for the long term USD picture with what I think is the most likely
wave count:

100404 USD Monthly Long Term Bear Market

If this USD wave up has finished, this is likely to have a very dramatic
effect on equities as well. I've said before that an ongoing strong
subwave up in USD was likely to at least cap equities into trading
sideways even if there was no corresponding equities retracement, and
equities have indeed been trading sideways for a couple of weeks now.

I was expecting that this would continue for another couple of weeks
while the balance of the USD wave up played out, and that we would then
see a powerful last wave up in equities while USD retraced. It now looks
likely that this is happening now rather than later, and if we are now
starting a period of USD retracement and consolidation that is likely to
last a few weeks, then during that time we should expect to see
equities surge ahead. On the SPX 60min chart you can see that the main
channel up since the low on Feb 5th is very much intact, and that we are
likely now to be starting the fifth and final subwave up within that
channel. I've marked the likely wave count on the chart and the fourth
wave seems to have formed an ascending triangle with a target in the
1200 area:

100404 SPX 60min Wave Structure since Feb 5th

In the longer term the main rising channel since the bottom in March
2009 is also very much intact. I have also marked the likely support and
resistance levels on the daily chart:

100404 SPX Daily Rally Channel and SR Levels

On quite a few charts we are seeing major reversals and breakouts here.
FXI has broken up decisively from a broadening descending wedge, gold
and oil seem to be breaking upwards too. I'm also seeing this on a lot
of individual stock and ETF charts that I have been looking at over the
last couple of days.

How far could equities rise? Difficult to say of course. I've liked the
61.8% fib retracement at 1229 for a while now and think SPX is likely to
get there, though it may go further. I have a target of 18 on XLF from a
broken and resolving rectangle:

100404 XLF Weekly Rectangle

The nightmare chart for bears is the Vix chart of course. On the weekly
chart there is a year-old gently declining channel where the next target
is somewhere between 13 and 14 depending on the time taken to get
there. Could it really get that low? I wonder, but the level of
misplaced complacency reached over the last year is already astounding:

100404 Vix Weekly Fan and Channel

We are not so much climbing a wall of worry in this market as surfing an
ever expanding wave of complacency that government intervention can and
will cure all economic ills.

When the government's credit starts getting tight, and that is likely to
happen within a year of two at most and perhaps much sooner, then we'll
see how much of this subsidised optimism can survive in an market operating without the Bernanke Put.