Slope initially began as a blog, so this is where most of the website’s content resides. Here we have tens of thousands of posts dating back over a decade. These are listed in reverse chronological order. Click on any category icon below to see posts tagged with that particular subject, or click on a word in the category cloud on the right side of the screen for more specific choices.
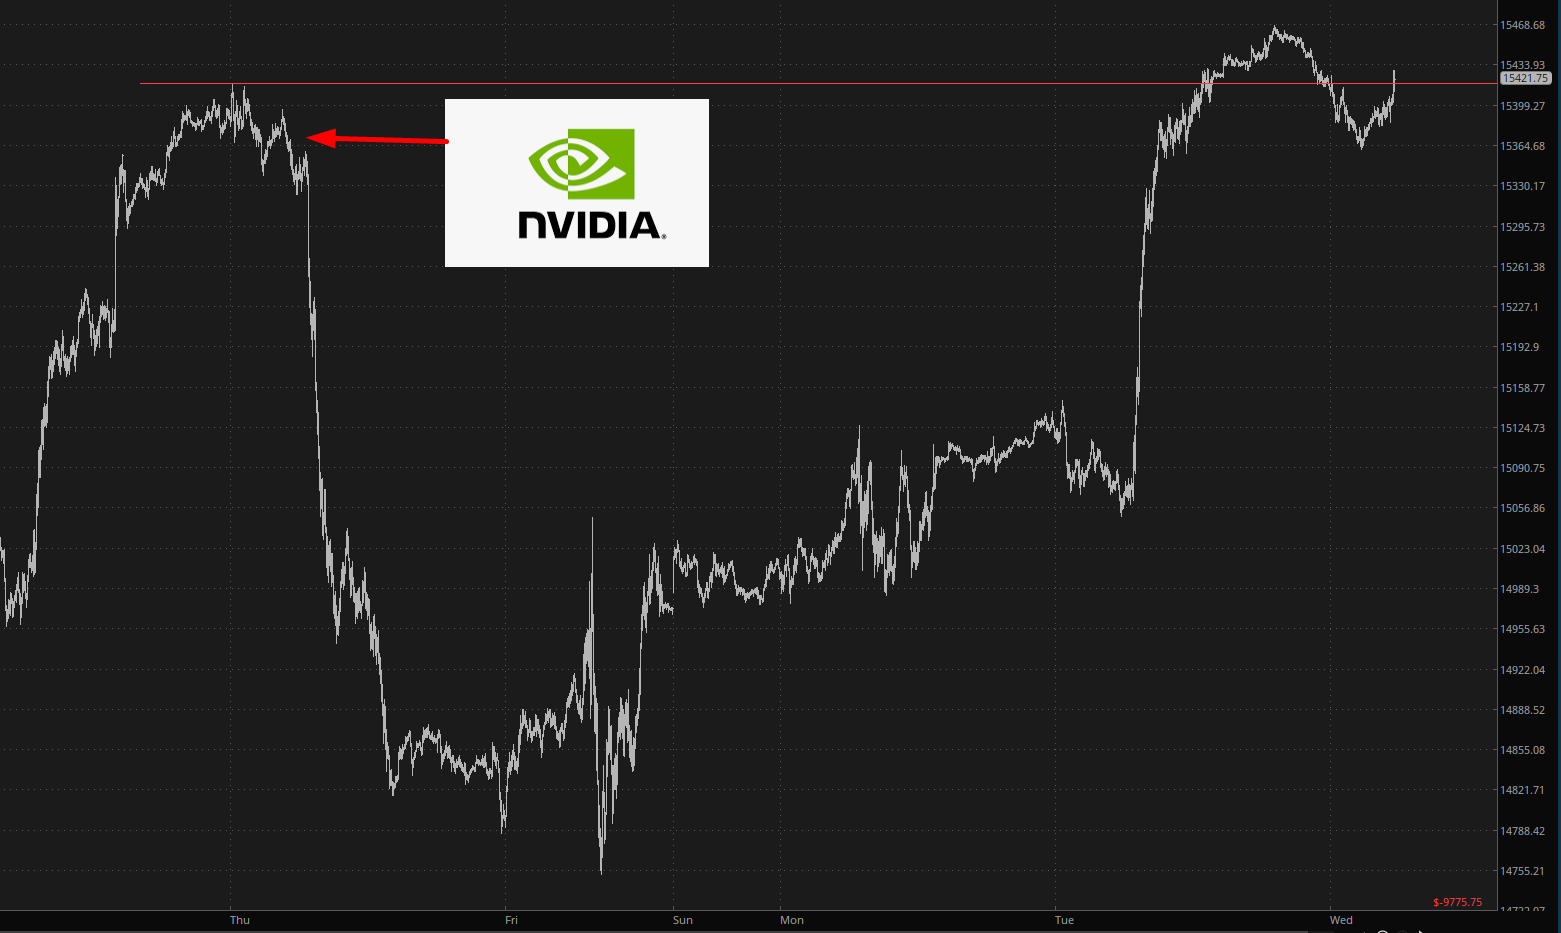
Good morning, everyone. Since evidently there’s no multi-month revision to faulty government data this morning, the markets are mellow and borderline boring. The /NQ had a tremendous surge yesterday, surpassing even the peak witnessed last week with the Nvidia blowout earnings.
Thanks to across-the-board revisions in faulty government jobs data, the stock market had one of its biggest rises of 2023 today. Stock market bears had been enjoying a very brief respite for a portion of August, but in recent days the bulls seem to have run roughshod over them all over again.
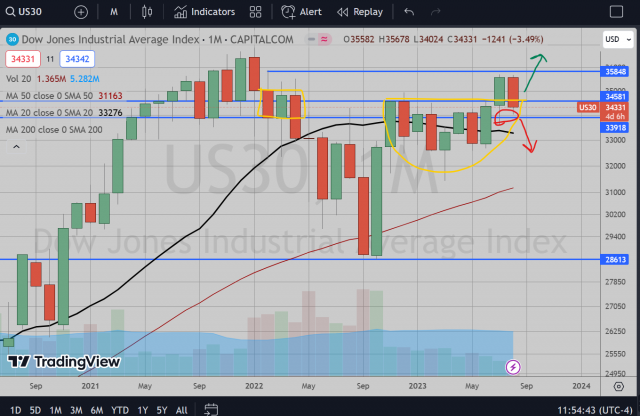
All hope is not lost. In the four major index charts below, all we have been doing is retracing back to major resistance. In the instance of the first and last charts, that resistance is in the form of a major Fibonacci level. For the second and third charts, the resistance is a price gap between August 1st and 2nd. Let’s see if these resistance levels hold true!
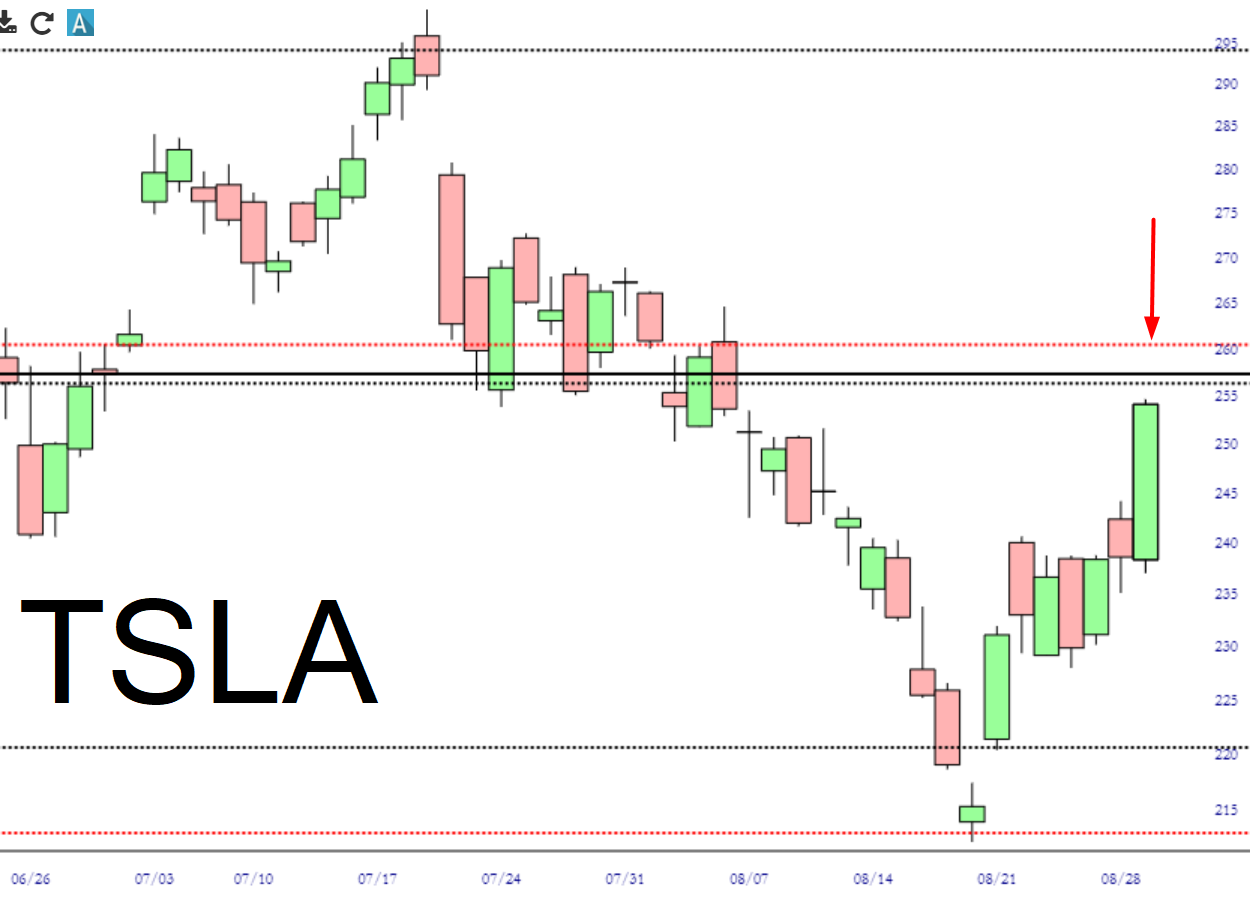
There are not just one, not two, but three Fibonacci levels all hovering above Tesla’s present price level. The stock is quite strong today, but it’s going to have a much hard time pushing past this formidable zone of resistance.
The stock chart of TSLA has been behaving itself quite predictably lately. The company has lost a quarter of its value in a matter of weeks, and after it pierced its supporting trendline (in blue, below) it was up to the Fibonacci retracements to hold the sucker up. The highest Fib failed yesterday, and the middle Fib has done a yeoman’s job keeping prices up (note the low of the day perfectly coincided with the value).