SPX and other indices finally broke away from the daily lower bollinger band yesterday, ending the ten day lower band ride downwards. My view here, though I could be mistaken, is that this is a counter-trend rally that will be followed by another move down to a lower low somewhere in the range between a test of the SPX 200 day MA, currently at 1710, and rising support from the 1074 low, currently in the 1650 area. My rally thesis would be weakened by a sustained move above the daily middle bollinger band, which closed yesterday at 1806. (more…)
Slope of Hope Blog Posts
Slope initially began as a blog, so this is where most of the website’s content resides. Here we have tens of thousands of posts dating back over a decade. These are listed in reverse chronological order. Click on any category icon below to see posts tagged with that particular subject, or click on a word in the category cloud on the right side of the screen for more specific choices.
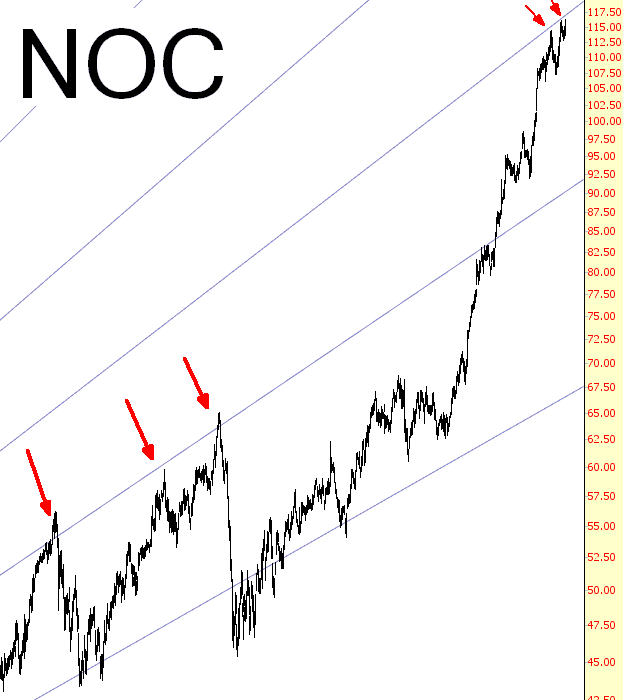
Northrop Fanlines
Although it didn’t stop it the last time I mentioned it, the fanlines for Northrop Grumman are again matching up against its price. Based on this, I’ve got a small short position on NOC:
Stuttering Downtrend
I’m not going to post the ES chart today, as not much has changed since yesterday morning and I’m short on time. ES is trading around the 50 hour MA (currently at 1825), which is saying that the retracement may be ending or ended. Bulls need to break back over 1833 ES confirm that the retracement is over and trigger a double-bottom target targeting new highs. (more…)
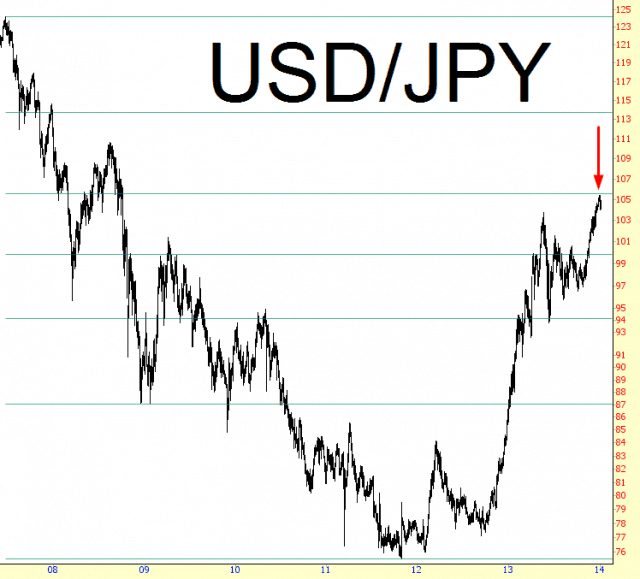
Yen Strength
It’s interesting to me that the USD/JPY is retreating so swiftly right now, in light of the almost perfect tag of the 61.8% Fibonacci line, marked below with an arrow. Yen weakness has, of course, been hugely responsible for equity strength lately. He that lives by the sword, dies by the sword.