Slope of Hope Blog Posts

Slope initially began as a blog, so this is where most of the website’s content resides. Here we have tens of thousands of posts dating back over a decade. These are listed in reverse chronological order. Click on any category icon below to see posts tagged with that particular subject, or click on a word in the category cloud on the right side of the screen for more specific choices.

Consolidation Time! (by Fujisan)

By -

It looks like the market finally started a correction on Friday, which was a major relief for both bulls and bears.  I'm happy that I can go short now and I have some bearish charts to share this week.

OPX Roadmap

Here is the road map that I laid out last Monday in the comment section, which worked out quite nicely.  I used the January OPX chart as my road map for Apr OPX week.

Roadmap 
Now, some of you asked me — what will happen next week?  Does this pattern hold?

My take on this is yes, it will.  It should bounce back up early next week, and then resume to the downside later on the week.

(My TOS chart is not working at the moment (is TOS down again?) and I won't be able to show you my ES hourly chart, but I see a H&S pattern formation).

I also mentioned that I'm expecting 4~8% correction for the coming 2 weeks, and then resume to the upside in early May.  My market view will not be changed unless the selloff accelerates with much higher volume. 

Trading GS

GS made a big drop on Friday, and I'm expecting this selloff continues. 

TM Daily Chart (for Comp Purpose)

This is what happened to Toyota back in January when they revealed the mechanical problems with Prius. 

Tm 
GS Daily

Here is the GS daily chart.  $124 is my short term target.

Gs_daily

Here is the GS weekly chart.

GS 
JPM Daily

JPM 
FAS Daily

Financials were being hit pretty hard on Friday due to the GS scandal.  $84.64 is my short term target.  I would have a better target price once the retracement is complete.

Fas

IYR Daily

Assuming IYR is going to form a H&S pattern, my short term target is $47.61 (will adjust my target after the formation of RS).

Iyr

DRN Daily (3x bull IYR)

Assuming DRN is forming H&S pattern, my short term target is $157 (will adjust my target after the formation of RS).

Drn

EUR/USD Pair

This currency pair is going through sideway consolidation and I have no sense ot direction until it breaks out of this rectangular pattern.  It closed the Sunday gap on Friday.

 Eur 

SPX Daily

I drew a trendline in all three major indices and they all hold the the trendlines and the other three still hold the major support levels.  COMP and RUT still look very strong.

Spx 

USD Retracement Will Push Equities Up (by Springheel Jack)

By -

My last post was on how the USD uptrend still looked intact despite the
sharp pullback into Wednesday's close. That remaining the case though
was dependent on USD reversing back upwards on Thursday which most
definitely failed to happen. The USD rising channel is not yet broken,
but there is now every reason to think that this USD wave up since
December peaked at 82.24:

100404 USD Daily Rally Channel

GBPUSD has broken up decisively on Thursday and EURUSD now looks poised
to do the same. They may yet turn back down, but that looks less likely
than a further move up.

In the context of the longer term, we are likely to have been watching
only the first wave (of 5 waves) of the third wave up since USD bottomed
at 70.7 in 2008. We should now see a significant retracement of the
wave up since December before the 3 of 3 starts and a much larger and
longer move up in USD begins. I have marked likely retracement targets
on the daily USD chart above. Here also is a look at the monthly USD
chart for the long term USD picture with what I think is the most likely
wave count:

100404 USD Monthly Long Term Bear Market

If this USD wave up has finished, this is likely to have a very dramatic
effect on equities as well. I've said before that an ongoing strong
subwave up in USD was likely to at least cap equities into trading
sideways even if there was no corresponding equities retracement, and
equities have indeed been trading sideways for a couple of weeks now.

I was expecting that this would continue for another couple of weeks
while the balance of the USD wave up played out, and that we would then
see a powerful last wave up in equities while USD retraced. It now looks
likely that this is happening now rather than later, and if we are now
starting a period of USD retracement and consolidation that is likely to
last a few weeks, then during that time we should expect to see
equities surge ahead. On the SPX 60min chart you can see that the main
channel up since the low on Feb 5th is very much intact, and that we are
likely now to be starting the fifth and final subwave up within that
channel. I've marked the likely wave count on the chart and the fourth
wave seems to have formed an ascending triangle with a target in the
1200 area:

100404 SPX 60min Wave Structure since Feb 5th

In the longer term the main rising channel since the bottom in March
2009 is also very much intact. I have also marked the likely support and
resistance levels on the daily chart:

100404 SPX Daily Rally Channel and SR Levels

On quite a few charts we are seeing major reversals and breakouts here.
FXI has broken up decisively from a broadening descending wedge, gold
and oil seem to be breaking upwards too. I'm also seeing this on a lot
of individual stock and ETF charts that I have been looking at over the
last couple of days.

How far could equities rise? Difficult to say of course. I've liked the
61.8% fib retracement at 1229 for a while now and think SPX is likely to
get there, though it may go further. I have a target of 18 on XLF from a
broken and resolving rectangle:

100404 XLF Weekly Rectangle

The nightmare chart for bears is the Vix chart of course. On the weekly
chart there is a year-old gently declining channel where the next target
is somewhere between 13 and 14 depending on the time taken to get
there. Could it really get that low? I wonder, but the level of
misplaced complacency reached over the last year is already astounding:

100404 Vix Weekly Fan and Channel

We are not so much climbing a wall of worry in this market as surfing an
ever expanding wave of complacency that government intervention can and
will cure all economic ills.

When the government's credit starts getting tight, and that is likely to
happen within a year of two at most and perhaps much sooner, then we'll
see how much of this subsidised optimism can survive in an market operating without the Bernanke Put.

Hamlet Has Left the Building (by Springheel Jack)

By -

We finally got a break down from the wave 3 channel on SPX yesterday:

100325 SPX 60min Wave Channels
About time too really, as making this interim top has taken way too long, and this has unfortunately wasted much of the period when it could have coincided with the strong wave up in USD.

The USD wave has been so fast and so strong that it looks unlikely to last too much longer. We could reach the top of the USD channel in the 83.5 area if we get there next week, and at the rate USD has been rising, it isn't impossible that we could reach it in the next two trading days:

100325 USD Daily Rising Channel
That's bad news for the retracement in equities, as there is a very distinct possibility that the retracement will end when USD hits the top of that channel, just as the bottom on Feb 5th was hit on the same day and at about the same time as EURUSD hit the bottom of the declining channel:

100325 EURUSD Weekly Channel
That makes the EURUSD target here of very considerable interest, and the clearest picture of that channel target  is on the weekly, where the highest the target could be is 1.30. Next week it should be at about 1.295. However we could get as far as 1.285 as the previous two bottom channel hits both pinocchioed through before bouncing.

In the very short term though, EURUSD has been bouncing overnight, and I'm expecting that it may well rise a little further to hit the bottom of the current short-term declining channel just above 1.34. Given the greater targets on this, EURUSD looks like a very nice short indeed from there:

100326P_EURUSD_Forex_Channel
One chart I've been checking very regularly for a while now is the XLF chart, where a beautiful rectangle top pattern has been building for several months on the weekly chart. Last week it was trading above the rectangle for much of the week, but returned to close within it last Friday, and I'm expecting to see the same thing happen today, which would mean a return to 15.75 or lower. As and when this does break, and assuming it breaks to the upside which is likely, the pattern target is 18. Rectangle tops of course, despite the name, break upwards 69% of the time:

100325 XLF Weekly Rectangle
I don't trade gold much, but this head and shoulders pattern, which could well play out over the next couple of days, also looks very inviting:

100326_GCM0_60min_HS_Pattern
Overall I'm expecting to see sharp drops in both equities and EURUSD today. I think that we're in a subwave 4 abc correction, and that we probably saw the a wave down yesterday and have been seeing the b wave retracement overnight.

I've marked in the fib retracement targets on the SPX 60 minute chart at the top, though it doesn't include the 23.6% target which would be 1158 SPX. I'm expecting to see 1144.5 SPX for the 38.2% fib target, and am hoping that we will see 1133 SPX for the 50% retracement, though I'm less optimistic about that now that we have wasted so much time making this top.

If we see anything lower than 1112.42 SPX then this wave count is wrong and the main wave up from March 2009 will most likely be finished already

Until and unless we see that though, this is just a short but pleasant interlude for the bears before another wave up, and is primarily a good opportunity to get good long entries.

Morgan Stanley (by Mike Paulenoff)

By -

Morgan Stanley (NYSE: MS) continues yesterday’s surge off of the bullish confluence EMA’s that bunched together just above 29.00, and which has helped to catapult the price structure towards a test of key resistance at 31.00/10. Purely from a technical perspective, the future of near- and perhaps intermediate-term price direction in MS will be determined by either a thrust above the Oct-Mar down trendline (31.00), or a violation of 29.00. Right now, the weight of evidence argues for a challenge of 31.00.

DmcTMt13l 

Should Bears Beware the Ides of March?

By -

Things seem to be lining up nicely for a significant interim top to be made early next week. $BPNYA looks to be one bullish day or so away from hitting the top of the declining channel. This has been a very good indicator of significant recent tops and bottoms in recent months:

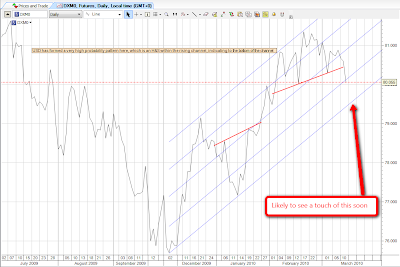
Similarly USD is only a short distance now from the bottom of the rising channel, and if it hits it, we should expect to see a new wave up in USD that should have a strong dampening effect on equities exuberance. Here it is on the DXM0 60min chart:

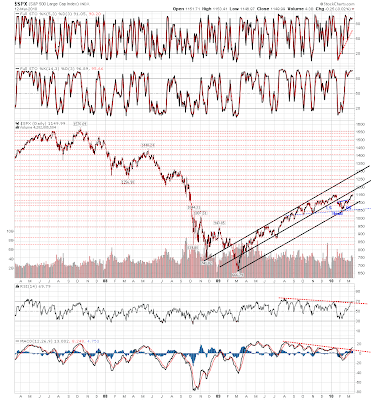
We are now only a few points away from the next serious resistance on SPX in the 1160 area. Here's the three year daily SPX chart showing the year-old rising channel with the significant support and resistance levels marked:

So everything is lining up nicely for the significant interim top that I have been expecting.

There are many saying though that we are on the cusp of a major rise in equities that will see us continue this already fairly long in the tooth upswing. Could it be so? Obviously it could. We are only ever weighing probabilities with market analysis. Lower probability outcomes are only ever just lower probability. What could make this potential parabolic rise a reality?

Well, these same three charts above could tell a different story. All channels break sooner or later, and every time that we reach the upper or lower trendline of a channel there is a significant risk that it will break up or down respectively. Equally, rising channels tend to break downwards just as declining channels tend to break upwards. There is obviously a significant risk that both the $BPNYA and USD channels will break next week.

The three year SPX chart tells a story too. If the strong resistance in the 1160 area is broken, the next really significant resistance level is in the 1200 area.

There is also a longstanding gently declining channel on the Vix. The lower trendline of that channel would be under 15 if we were to touch it in the near future, and a major push upwards in equities could make that happen. If so however, the very significant top at the end of that push upwards should be signalled by the Vix touching the bottom trendline of the channel, and we should at the least see a very significant retracement after that:

This parabolic rise to the next interim top could happen, but it isn't really any particular cause for alarm for traders. If this scenario were to play out we would know quickly as the 1160 resistance would be broken with confidence and most likely the USD and $BPNYA channels would be broken at the same time. Any rise would also still most likely be confined within the strong rising ES channel, which is sufficiently steep to be reasonably confident that when it breaks, it will break down rather than up:

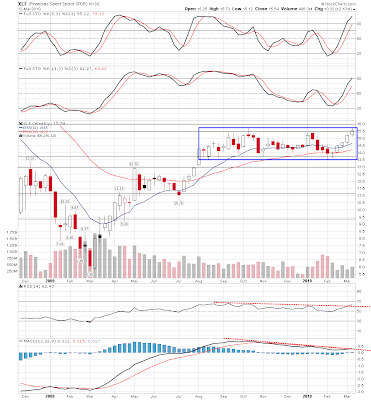
There is another indicator I will be watching closely as well, which is the very longstanding rectangle pattern on the weekly chart of XLF, the Financial Sector SPDR. At the moment it has made a perfect touch of the top of the rectangle and is back on the way down to the bottom. That is very bearish for equities generally in the near future. This is a particularly good example of a rectangle by the way, with perfectly exact touches of the bottom and top trendlines, a breakout either way has a good chance of making the rectangle target, and any close above or below the rectangle will be a very strong bullish or bearish indication for equities generally depending on the direction of the break.

However, the rectangle is of course a generally bullish pattern with 69% of breakouts to the upside, and upward breakouts particularly are often signalled by a partial decline in the rectangle before a second touch of the top trendline, so if we see the top of the rectangle touched again next week that would be a strong warning of a potential upside breakout with a target of 18.5, and to reach that target would likely require a major wave upwards in equities.

All in all though, there is a very strong probability that we are about to put in at least a significant interim top on equities. Oil and gold both broke downwards from their respective short term rising wedges on Friday, with targets of 72.5 and 1060 respectively, and while of course it is still possible that they will break back upwards, it is unlikely. Resolving to those targets would fit with a strong retracement in equities and that is what I think we will be seeing for most of the rest of March.