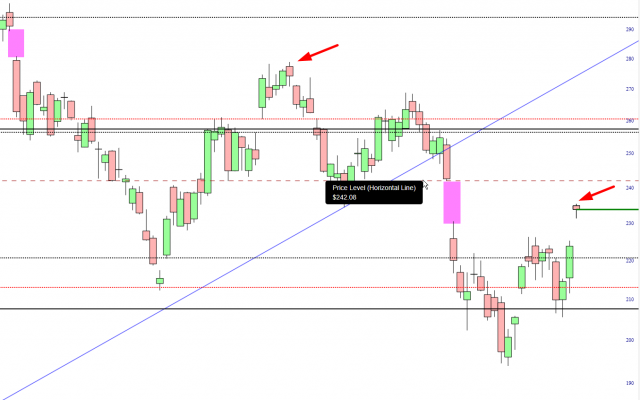
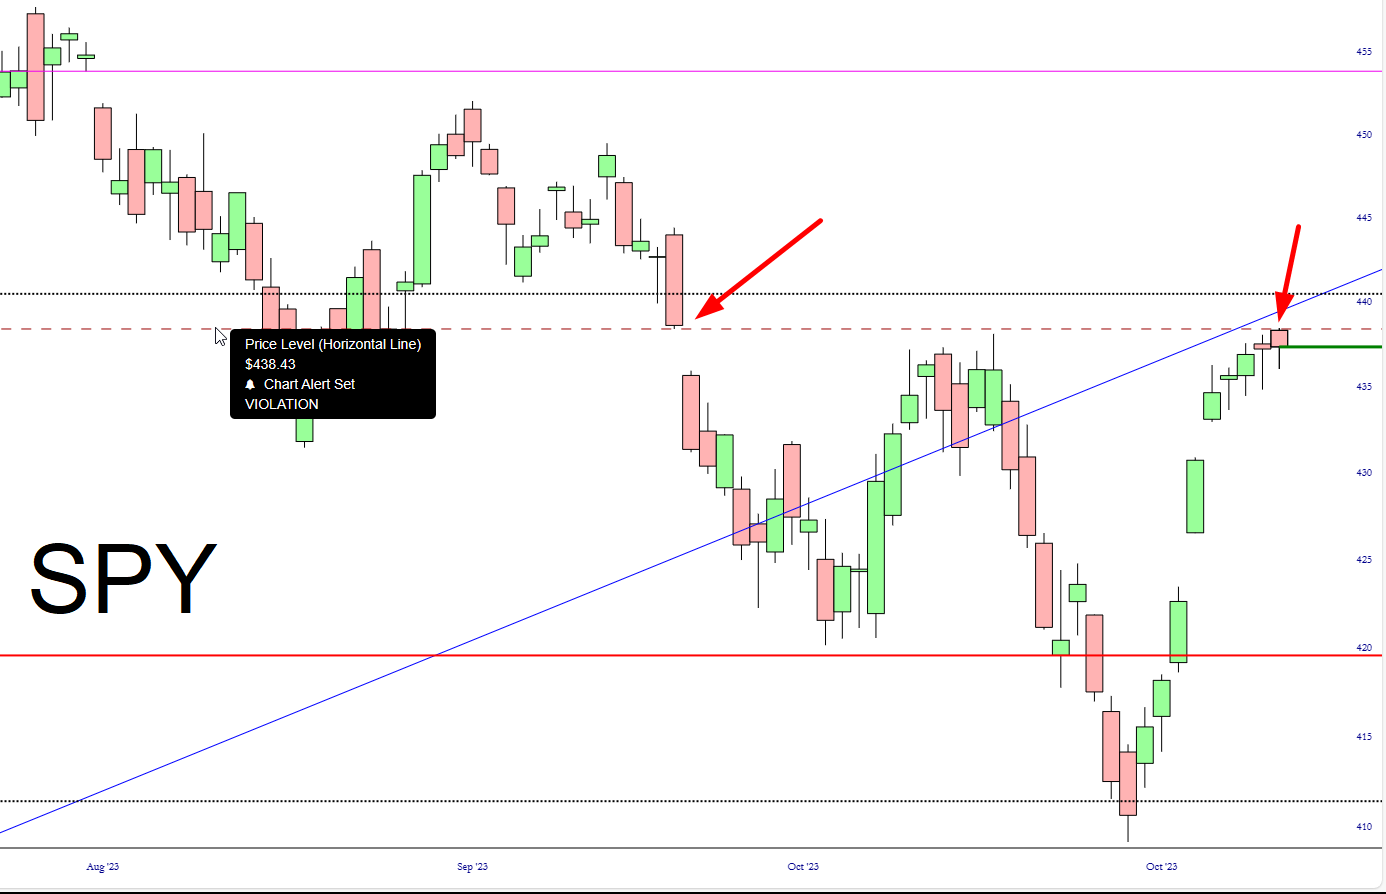
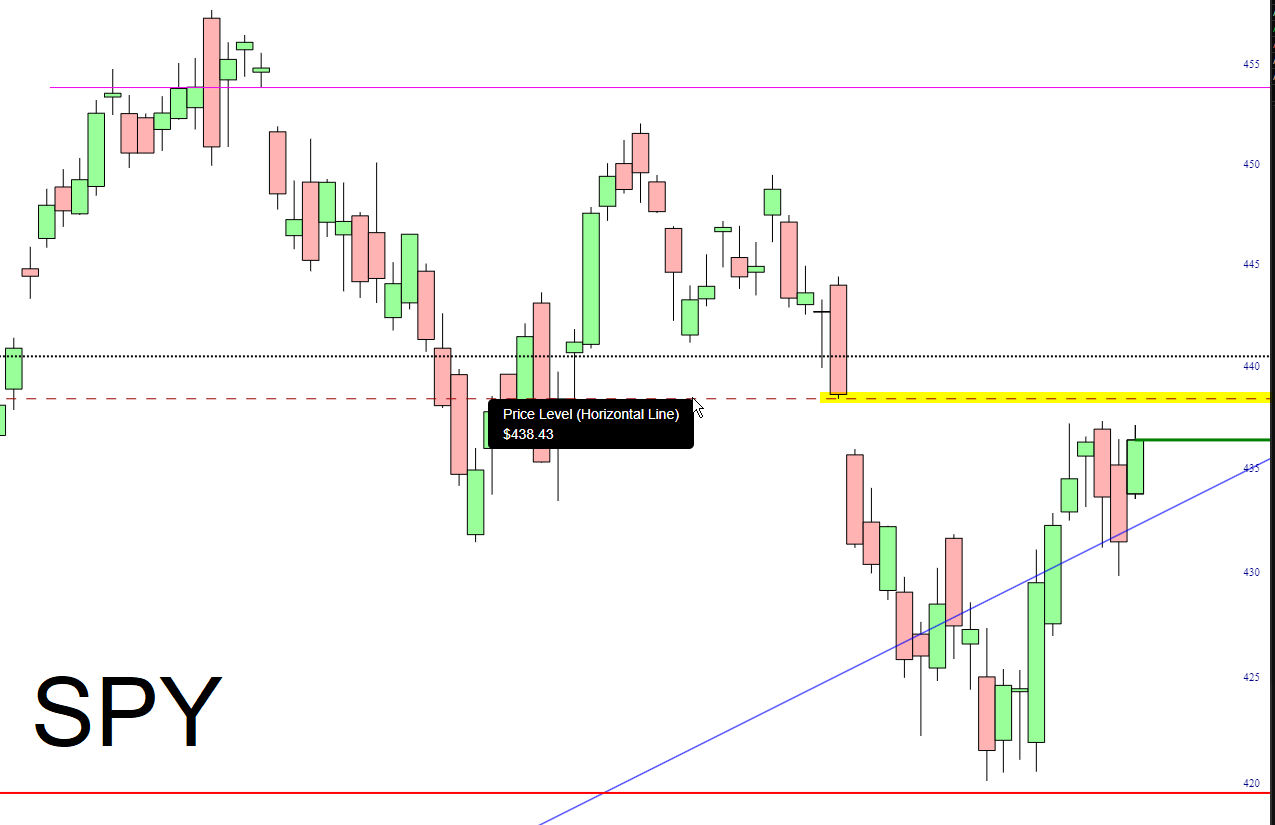
Slope initially began as a blog, so this is where most of the website’s content resides. Here we have tens of thousands of posts dating back over a decade. These are listed in reverse chronological order. Click on any category icon below to see posts tagged with that particular subject, or click on a word in the category cloud on the right side of the screen for more specific choices.
So Jerome Powell’s speech had the market ‘on edge’ before the opening bell, but the real story centers on “The 4400” for the S&P 500 futures.
(Author's note: Yes I'm not dead. Just dealing with major health problems for my dad taking nearly all of my time away from trading. That's why I've been MIA from Slope since July.)
It seems like quite a dull day so far. I went ahead and ditched my GDX and GLD puts at a pint-sized profit, and I’ve trimmed back here and there to build my cash up to 10.1%. I think I’ll be doing no other trades today. What’s key at this point is the price gap on the SPY which, thank the market gods, we’ve stayed beneath. I’m planning to be on my first vacation of the century in a few weeks, so I’d appreciate it if the market could blow up so I could get out of my positions and take it easy!
Yesterday I suggested to my beloved Gold and Platinum members to go bearish on Apple and Amazon. So far, so good! And, at the moment, both of them are sporting superb bearish engulfing candlestick patterns.
The past few days have provided a much-needed relief rally to the market as a whole. Across a wide span of financial assets, a quick and powerful upsurge has sprung prices from the depths toward what I perceive as vitally-important zones of resistance. These take the form of price gaps, Fibonacci resistance levels, or simple horizontal lines, but in each case it will take very little to complete the trip to these exhaustion zones (or, if you’re inclined to be bullish, the same charts show that it wouldn’t take very much to violate these levels of resistance and put even more wind into the bullish sails).
Below are twenty-one ETFs I believe illustrate this succinctly. I’ll share a few words preceding each chart to summarize why I think it is at a meaningful price juncture.
We start with the commodities fund, which re-penetrated its descending price channel and formed a small rounded top. The war in Gaza pushed oil prices strongly higher, but the price gap caused between Friday and Monday is close to being sealed. Oil is the biggest component of DBC.