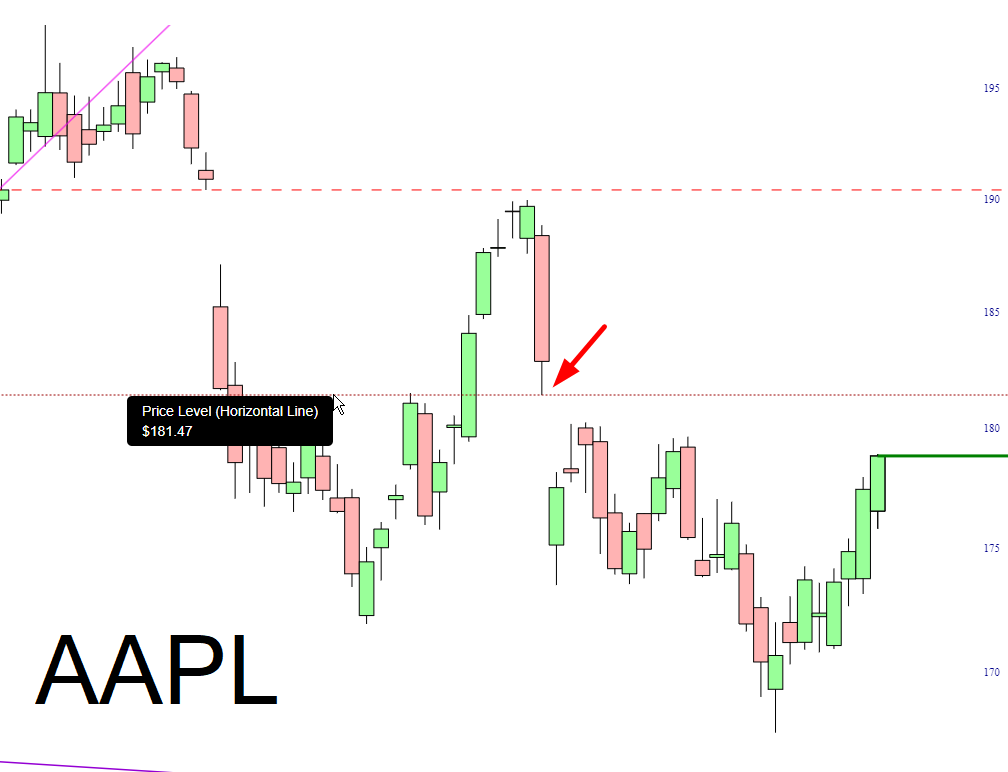
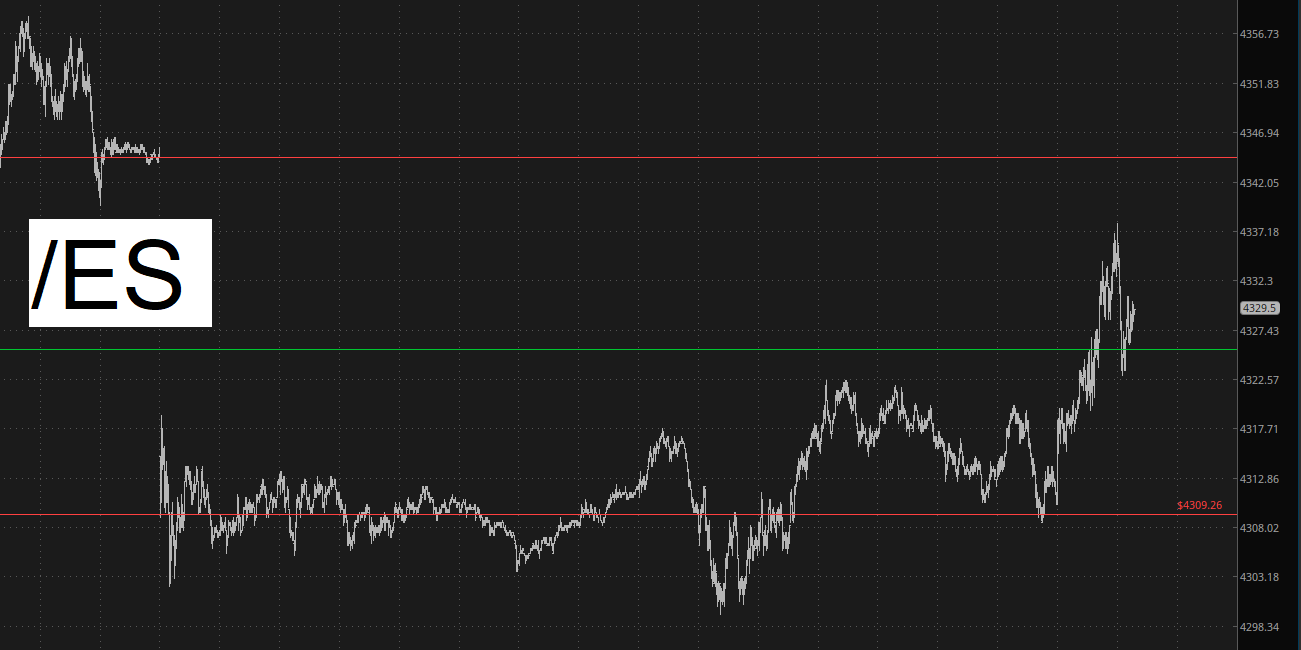
The past few days have provided a much-needed relief rally to the market as a whole. Across a wide span of financial assets, a quick and powerful upsurge has sprung prices from the depths toward what I perceive as vitally-important zones of resistance. These take the form of price gaps, Fibonacci resistance levels, or simple horizontal lines, but in each case it will take very little to complete the trip to these exhaustion zones (or, if you’re inclined to be bullish, the same charts show that it wouldn’t take very much to violate these levels of resistance and put even more wind into the bullish sails).
Below are twenty-one ETFs I believe illustrate this succinctly. I’ll share a few words preceding each chart to summarize why I think it is at a meaningful price juncture.
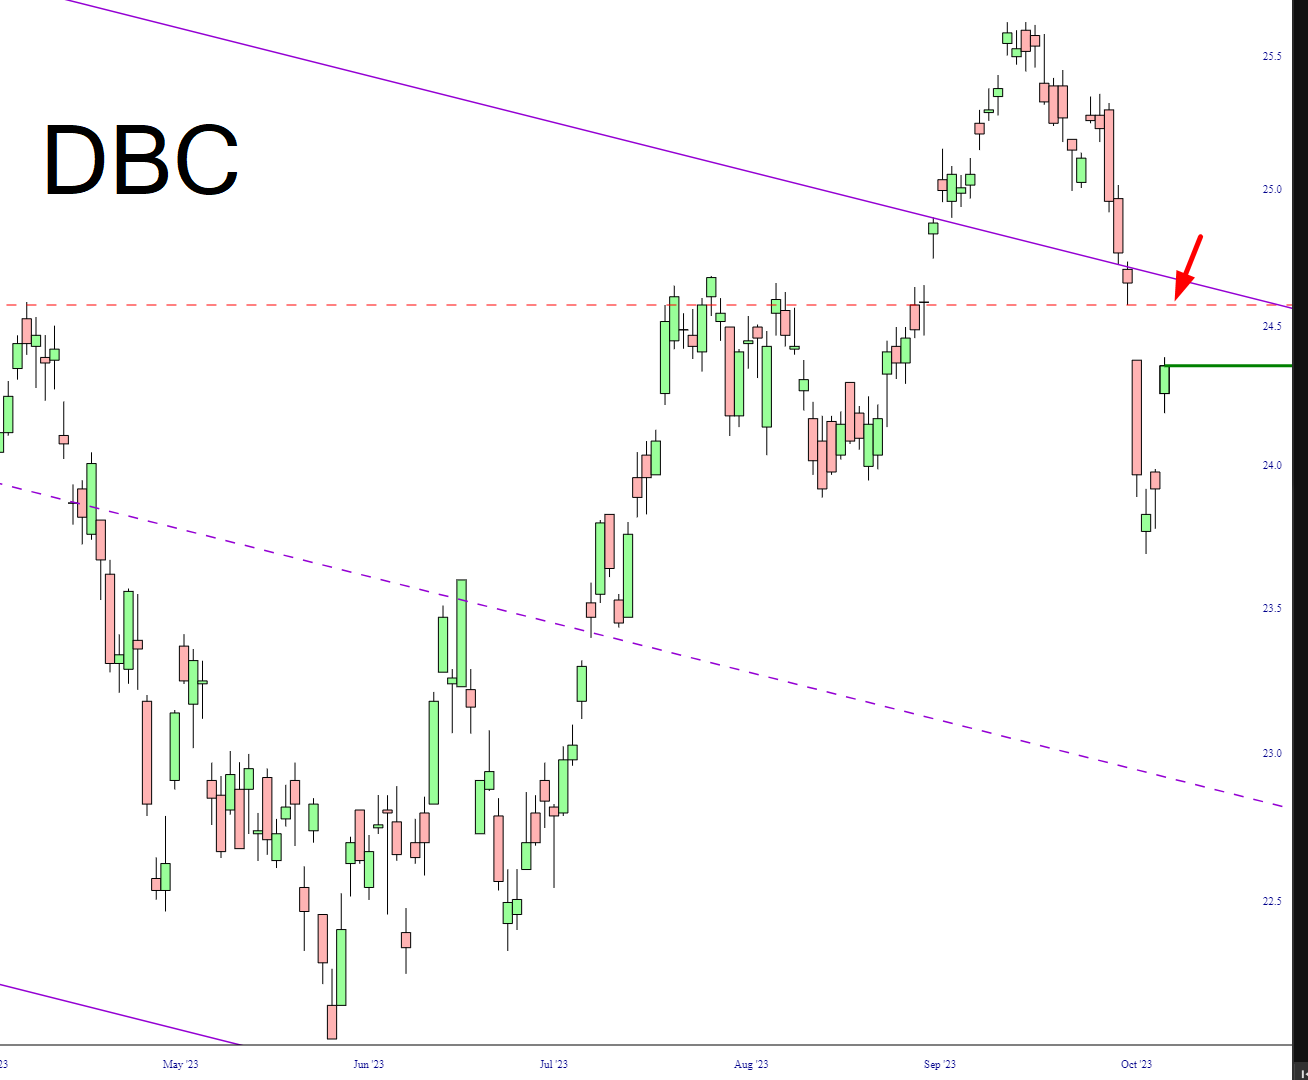
We start with the commodities fund, which re-penetrated its descending price channel and formed a small rounded top. The war in Gaza pushed oil prices strongly higher, but the price gap caused between Friday and Monday is close to being sealed. Oil is the biggest component of DBC.