
So Jerome Powell’s speech had the market ‘on edge’ before the opening bell, but the real story centers on “The 4400” for the S&P 500 futures.

(Author's note: Yes I'm not dead. Just dealing with major health problems for my dad taking nearly all of my time away from trading. That's why I've been MIA from Slope since July.)
Yes trade fans, while the headlines all overnight and early this morning hyped J-Pow…
All we got is this (per tos global news): 09:15 News Bot: Fed Chair Powell does not comment on monetary policy or the economic outlook in prepared remarks
Whoops! Well there goes that reasoning for the bearish down push after the /es futures broke above Tuesday’s high, then took all of ten minutes to reverse back to the globex open.
For us technical traders there’s a much simpler explanation shown on the chart as the key: The 4400 level.
Behold the daily chart of the /ES
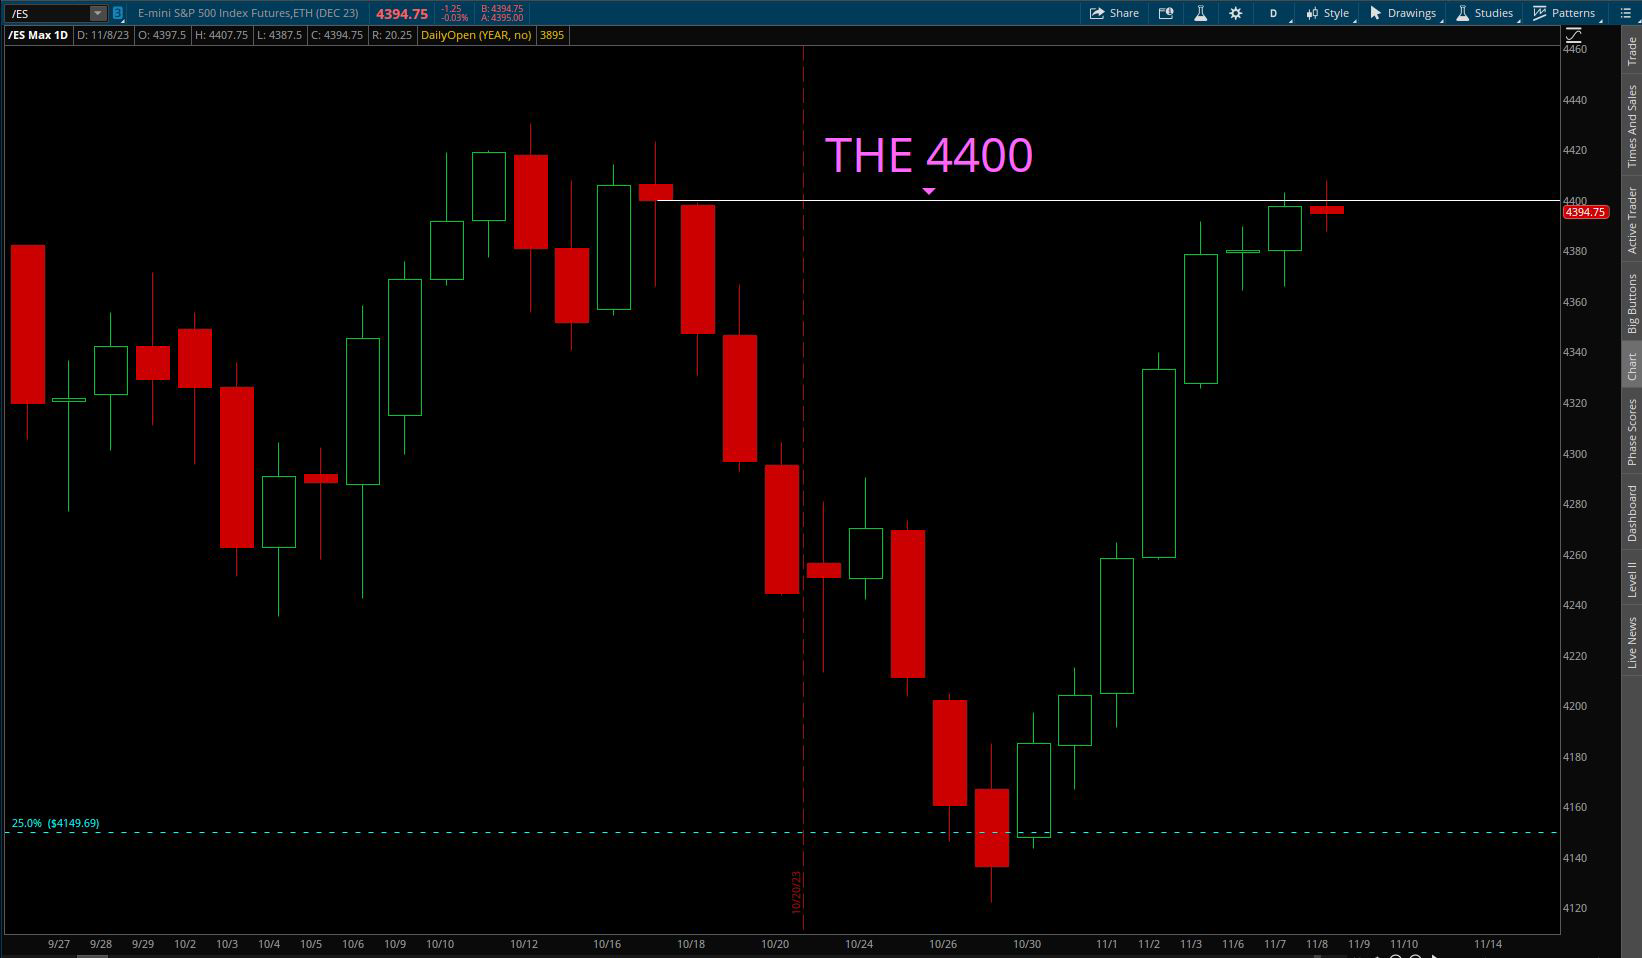
Journey with your eyes back to October 17-18th, and note the overnight gap down in the futures contract.
- October 17th’s trading closed at 4400 even.
- October 18th’s trading opened the GLOBEX session at 4398, and NEVER CLOSED THE GAP DOWN.
Fast forward with your eyes to yesterday’s price action, where price action finally rose all the way back to close that gap down… but still DID NOT CLOSE ABOVE 4400.
Then look at your intraday chart for today, and not what happened after price rose above that 4400 area once again (so far).
So what can you as a trader take away from this?
1 – It took 15 trading days to re-trade back up to that 4400 level
2 – We’ve seen two tests and failures so far by bulls trying to reclaim that level on a closing candle basis
3 – For the bulls to signal additional upside in a clear manner, the 4400 level must be closed above
Note for divergence purposes, the /NQ bulls closed its October 17-18 gap down yesterday with a strong bullish candle.
BONUS: Oil’s potential bearish continuation signal
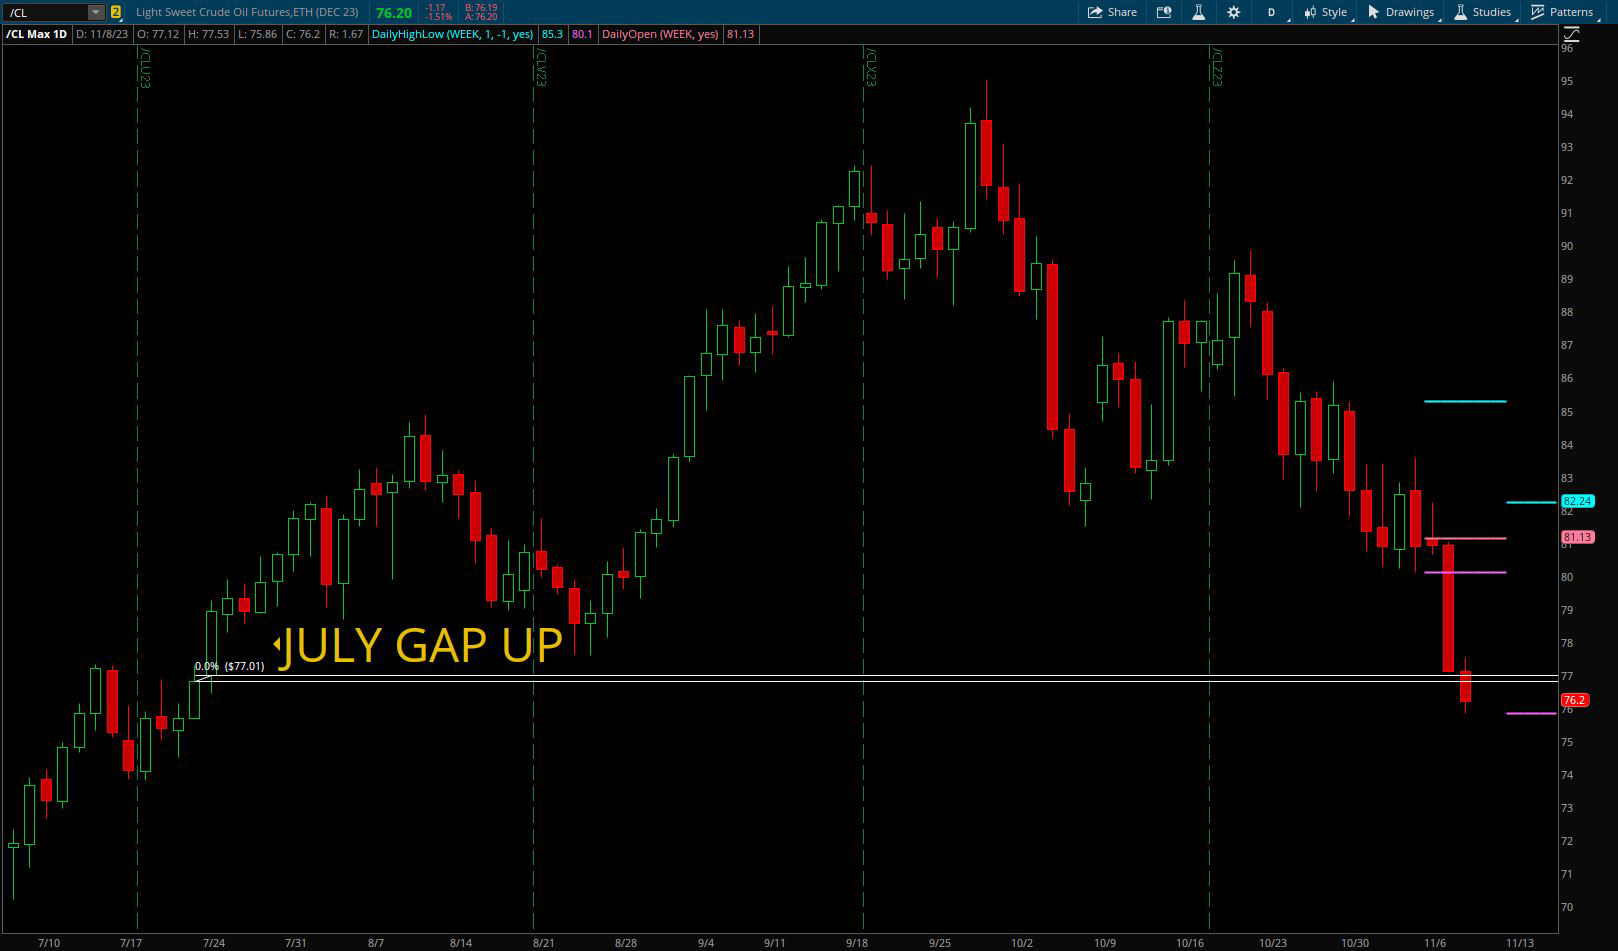
The rally in treasuries (and this lower interest rates) is coming with money from somewhere, and that place appears to be the oil patch… which just happens to be at a key technical weekly level.
Note the gap up on the weekly chart from July 21-24th (76.83-77.01) on the continuous /cl futures chart.
Though price action traded back through that gap, it never closed through it.
Fast forward to today’s trading, and as of 10:00 a.m. EST we find price beneath that gap.
Overnight price action see-sawed on both sides of the gap, with the first hour of the old U.S. cash session trade (9-10am EST) seeing the overwhelming majority of trade beneath that gap.
If the oil bears and traditionally bearish seasonality can close the weekly candle beneath the 76.83 gap level, it would provide a clear signal that longer term bearish price pressure should be in play. Thus rallies should look to be sold.
Should the weekly candle fail to close beneath the gap, we will likely see a fast short-covering rally toward the $80 level.
