x

Slope initially began as a blog, so this is where most of the website’s content resides. Here we have tens of thousands of posts dating back over a decade. These are listed in reverse chronological order. Click on any category icon below to see posts tagged with that particular subject, or click on a word in the category cloud on the right side of the screen for more specific choices.
x
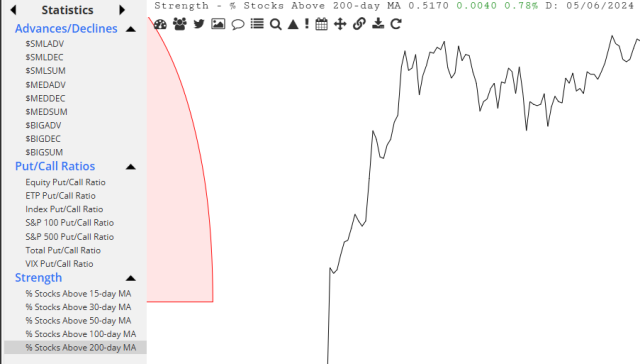
I’ll take this opportunity to remind you that SlopeCharts has a variety of interesting Statistics you can use to examine underlying market strength and sentiment.
In my last posts on In Monday 12th May and Thursday 22nd May I was looking at the possible setup for a retracement on Crypto that might then set up a substantial bull run on Crypto after that retracement was complete. That retracement is not yet necessarily complete, but I think it may well be, so today I want to look at that retracement, explain why I think that may be ending a bit early, and look at the large bullish IHS patterns forming on Solana (SOLUSD) and Ethereum (ETHUSD) that may deliver major high retests on both while Bitcoin (BTCUSD) makes substantial new all time highs.
Looking at the daily chart Bitcoin broke below the daily middle band into a test of the lower band, the 50dma and the 100k level. They held as support and Bitcoin is trying to break back over the daily middle band. The daily RSI 5 sell signal reached the full target. If the daily middle band is successfully converted back to support then this retracement is likely complete.
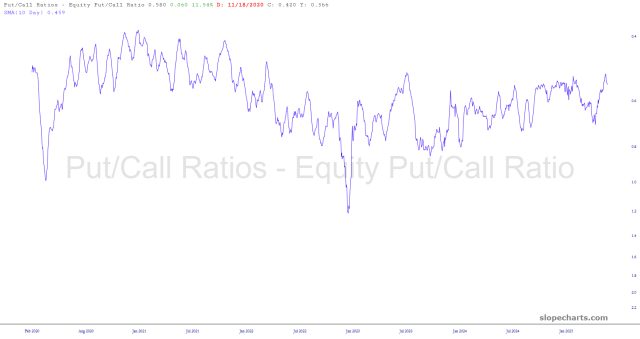
(more…)I read an article from our friends in Gainesville that gave me an idea to share. What the boys at EWI do is take the put/call ratio (which we now have in SlopeCharts) and do two things to it: (1) they create a 10-day moving average to smooth it out (2) they invert the scale so that a chart basing and curling up indicates a bottoming market overall, and a chart topping and starting to curl down means just the opposite.
I have made these modifications, and hidden the raw data used to compute it, in the five charts below. Enjoy!
Back in my post on Friday 16th May I was looking at the daily RSI 5 spike over 90 on SPX and noted that:
‘From here this means that SPX likely at least consolidates without going much higher for two weeks and then we could see a larger retracement but without any strong expectation of a big decline. I am wondering though about a possible backtest of the 200dma, currently in the 5760 area‘
It has been two weeks since then and we’ve seen that consolidation with a low at the backtest of the 200dma. Is there anything obviously bearish about this consolidation? Not yet, and I am still looking for likely retests of the all time highs on SPX and QQQ, and perhaps also on DIA and IWM, though I’m still thinking that an equities moonshot through the rest of the year seems unlikely.
In my premarket video for paying subscribers on Friday morning I was looking at an interesting setup on ES and NQ, where both had and still have decent quality double tops, and a smaller H&S had formed on both that on a break down would have a target close to the larger double top support levels.
(more…)