A Note from the Publisher: Over the weekend, long-time Sloper Silver Singularity composed an epic post. Indeed, it is so epic that I sought and received his permission to make it visible ONLY to paying members. It’s a long one, so I’m going to leave it up for a while to give folks a chance to read it.
I’d like to offer a couple of deep discounts to encourage people to subscribe (and get immediate access to this post). Click here to get BRONZE for 99 cents for the first month (you can swing that!) and a permanent discount thereafter, or click here to get GOLD for the same can-you-believe-how-cheap 99 cents for the first month as well as a permanent discount. And, hey, this article by itself has got to be worth 99 cents, so even if you don’t intend to use a membership, you can always cancel before a month passes and still try out all the membership benefits! C’mon!
Hey Slopers, happy new year and I’m back with some crispy food for you!
This is certainly the most interesting time since I’ve been in the markets, I think we are at a very critical time and let me explain why:
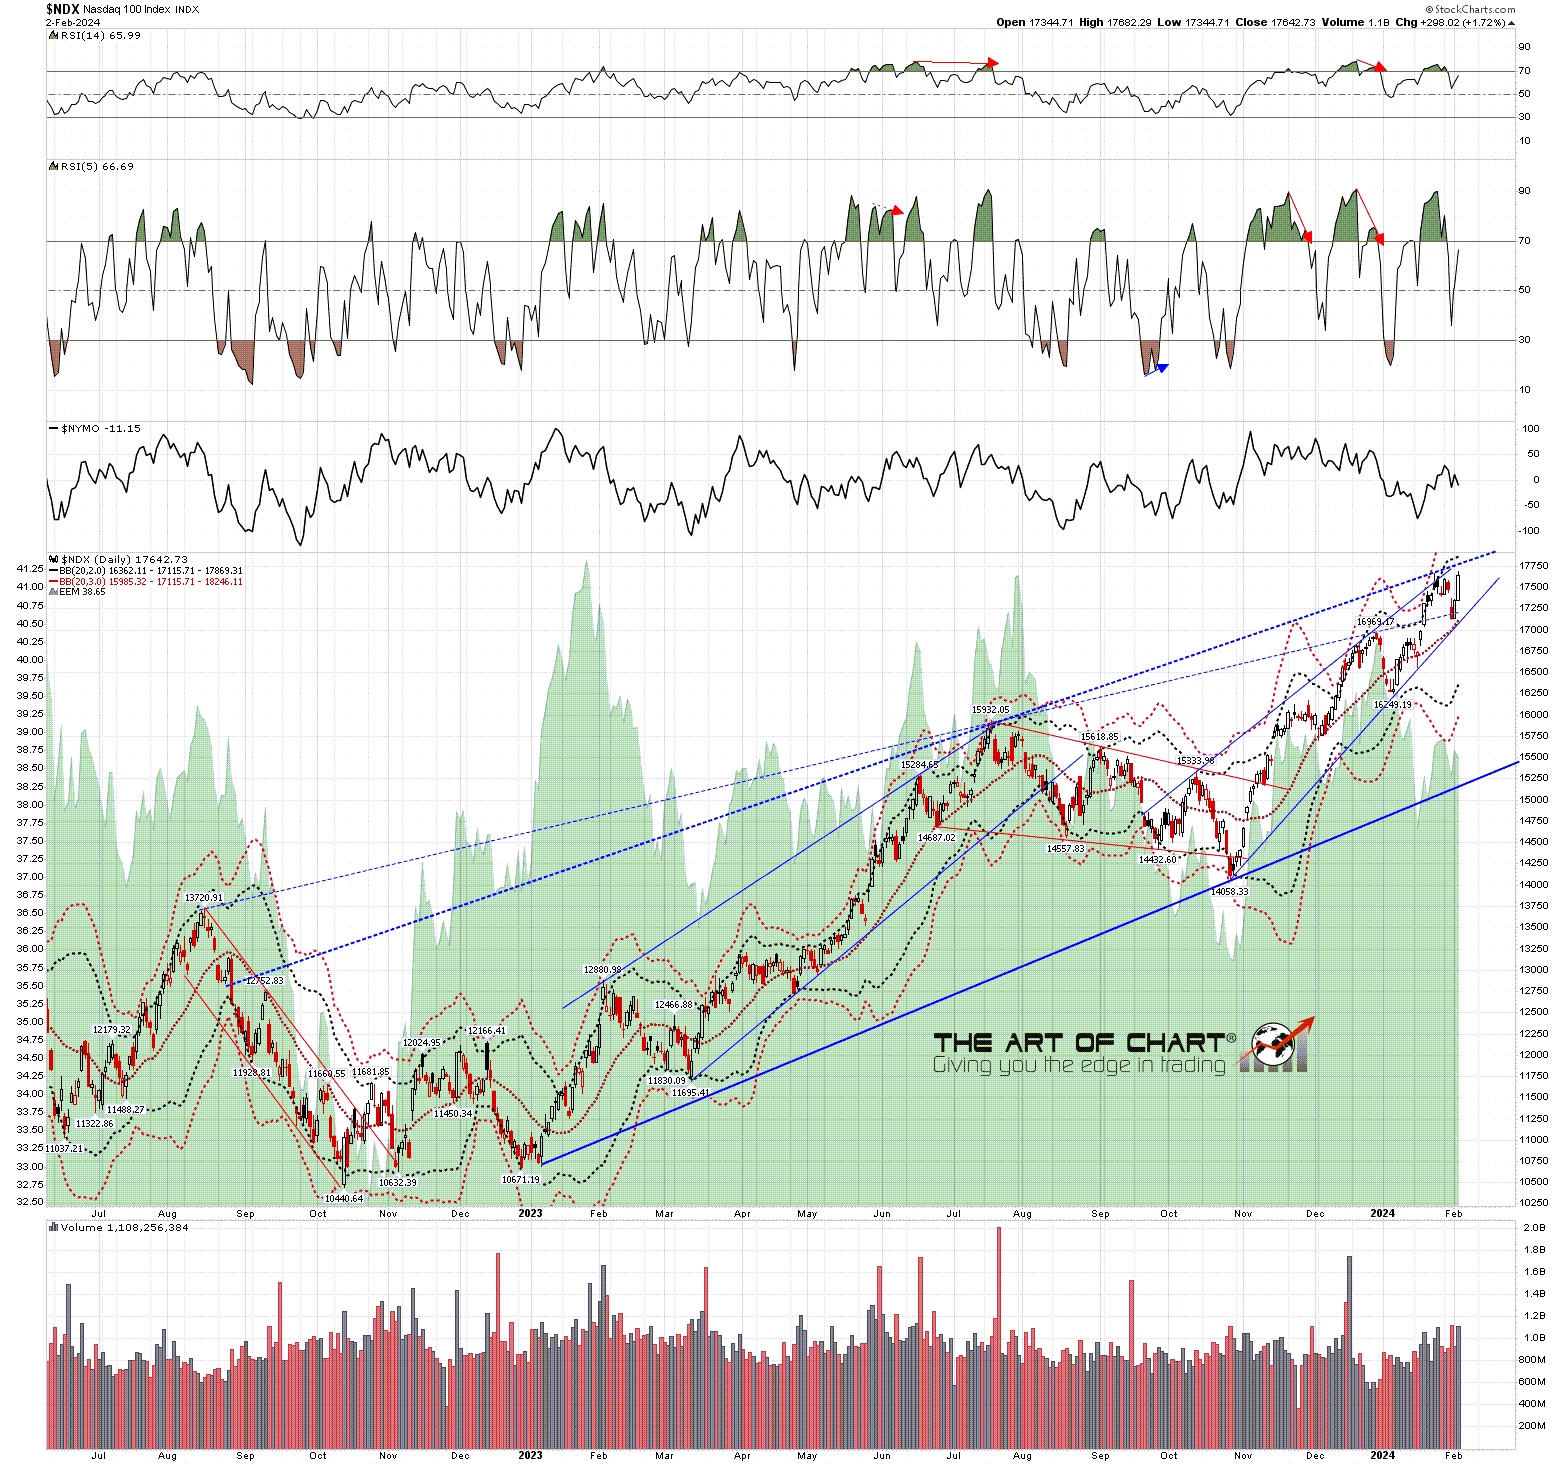
Here we are back at all time highs for the three big indexes after a rapid digestion of the pullback we had this summer, pullback that was once again driven by long term rates.
And today you know the narrative: “soft landing, rates are going down because the inflation fight is over and the FED is going to be our friend again so we’re so back baby!”
Btw the bond market has become such a holy temple of volatility nowadays that it has become a little scary. Crazy how the market has been getting used to it at first glance.
(more…)