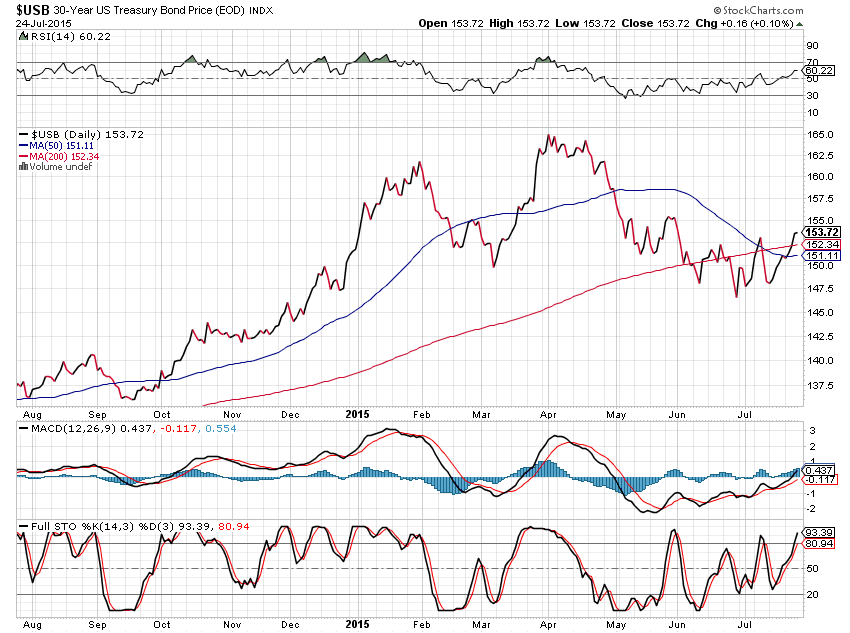
The following 1-Year Daily chart of 30-Year U.S. Bonds ($USB) shows that a bearish moving average Death Cross has recently formed — warning that lower prices may be in store. However, the rising RSI indicates building strength from May through July.
Slope initially began as a blog, so this is where most of the website’s content resides. Here we have tens of thousands of posts dating back over a decade. These are listed in reverse chronological order. Click on any category icon below to see posts tagged with that particular subject, or click on a word in the category cloud on the right side of the screen for more specific choices.
The following 1-Year Daily chart of 30-Year U.S. Bonds ($USB) shows that a bearish moving average Death Cross has recently formed — warning that lower prices may be in store. However, the rising RSI indicates building strength from May through July.
By Biiwii
In case you thought you were smart enough to know why the Fed wants to do what it supposedly wants to do [1] MarketWatch sets you straight with the real scoop. We’ll use this as a talking point and see what comes of it…
Policy makers want to give themselves some room to maneuver
That is the commonly held belief and who am I to dispute it? A big part of the problem is and has been their refusal to begin a journey toward normalization 2 years ago, when the economy began to visibly (we noted the seeds of that improvement in January of that year) improve. They had no confidence and I was left to wonder (aloud here, frequently and I am sure, sometimes obnoxiously) why Grandma [2] (and her 0% savings account payout) had to continue to bear the brunt of this non-action despite a recovering economy.
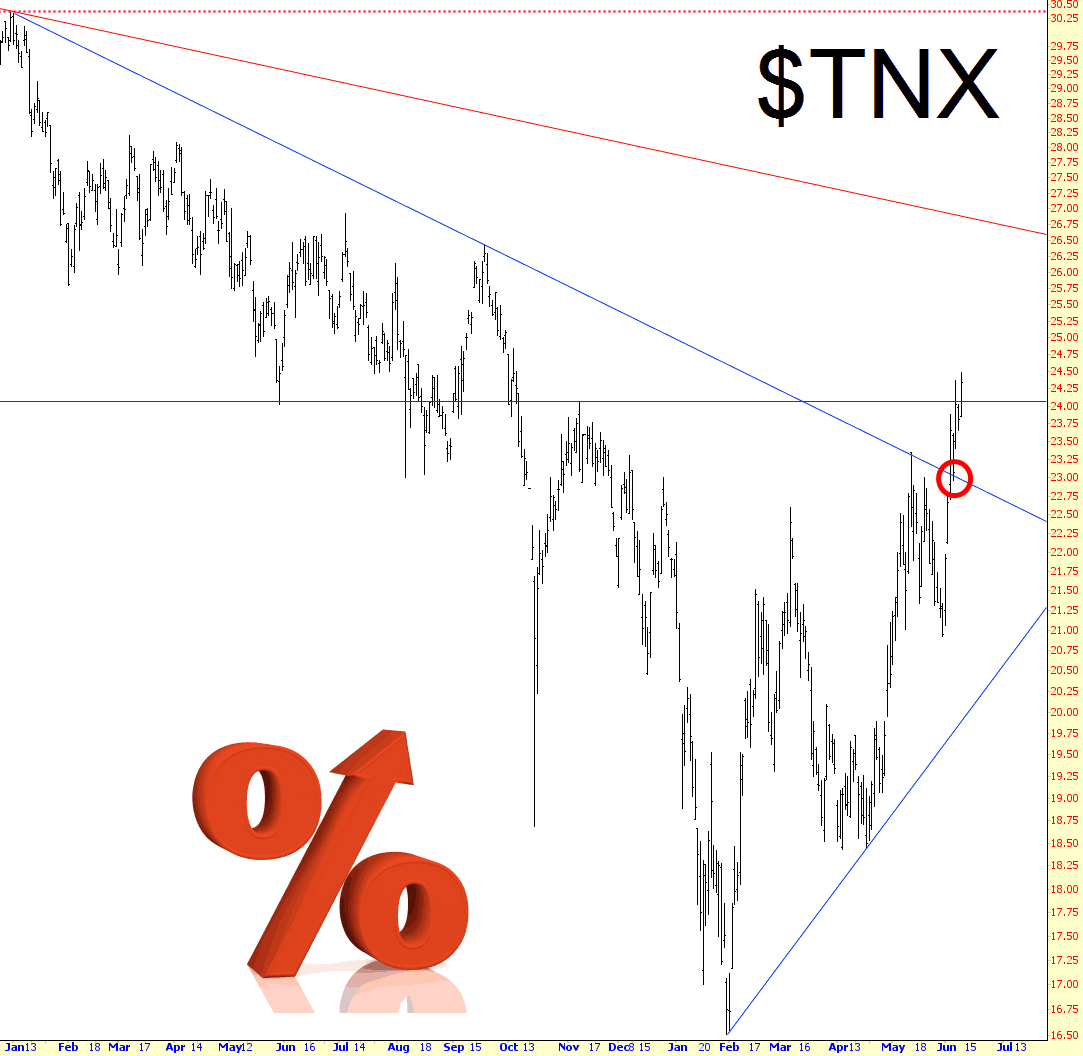
During the past 3-4 weeks, my preferred scenario called for the 10-year Yield to stall at around 2.50% followed by a decline into the 2.10-2.00% support zone prior to my expectation of the emergence of a new up-leg that propels Yield to 2.90-3.00%.
That said, however, my near-term pattern work is warning me that last week’s (Jul 9) low at 2.17% followed by a sharp rally to yesterday’s high at 2.47% signifies the end of a June-July correction and the initiation of a new up-leg.
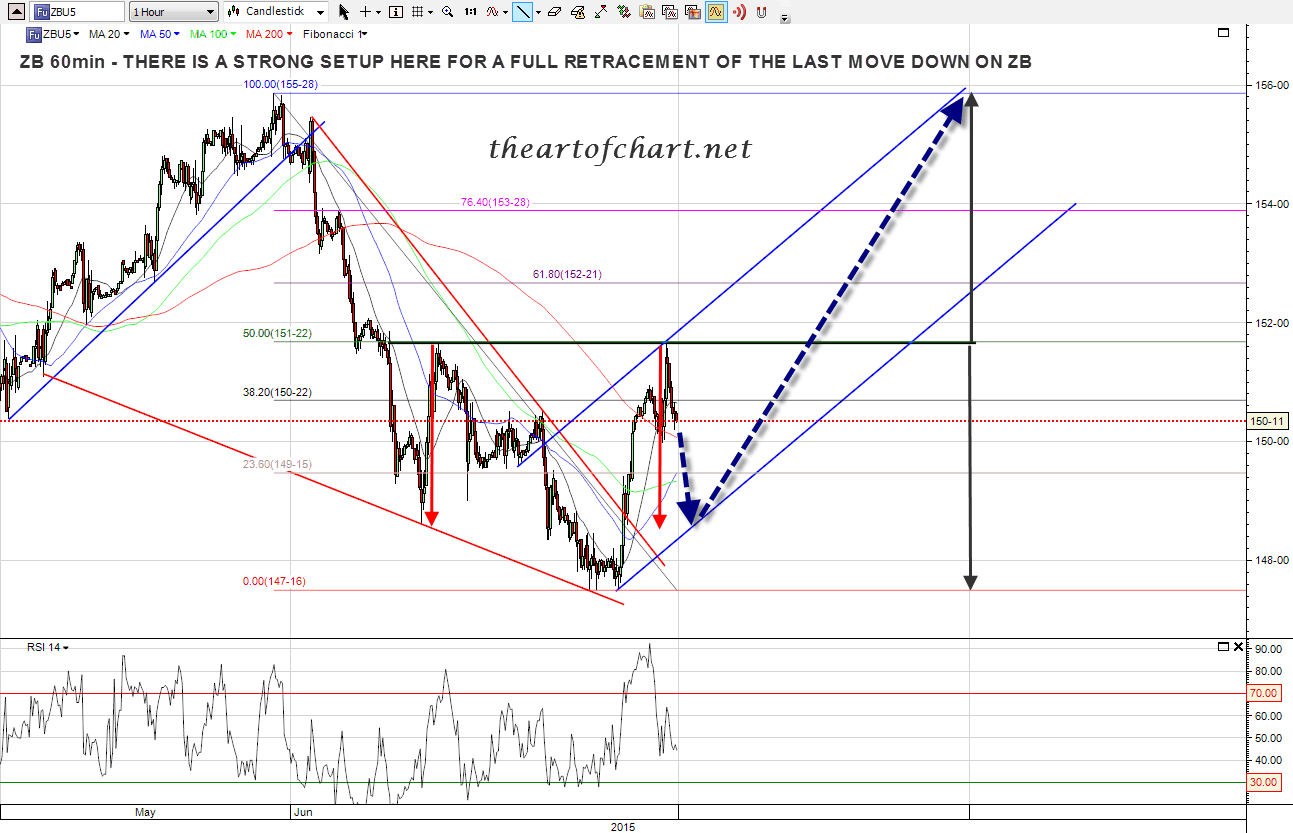
I said on Wednesday morning that I was looking for a slightly lower low on TLT before a likely full retracement of the last move down. After that lower low and the wedge breaking up i was wondering whether an IHS might form at the obvious possible IHS neckline at the 50% fib retrace. On the ZB (30yr treasury future) below you can see that ZB reversed on Friday at that 50% fib (TLT reversed a little lower) and if this IHS continues to form then on a break over the neckline the target will be the 100% retracement of the last move down that I was looking for last Wednesday. ZB 60min chart:
When I pointed out the trendline break interest rates made last week, there was a hail of chortles and catcalls about how useless it was, since it was so “obvious”. There is nothing wrong with an obvious trendline break. Just because you know that more than one person is watching a given technical breakout doesn’t invalidate it.
The naysayers got one day of glory, as interest rates did dip and simply test the breakout the next day, but since then, it’s been up, up, and away. I’d say that the nations of the world, which are countless trillions of dollars in debt, are pretty much screwed and tattooed.