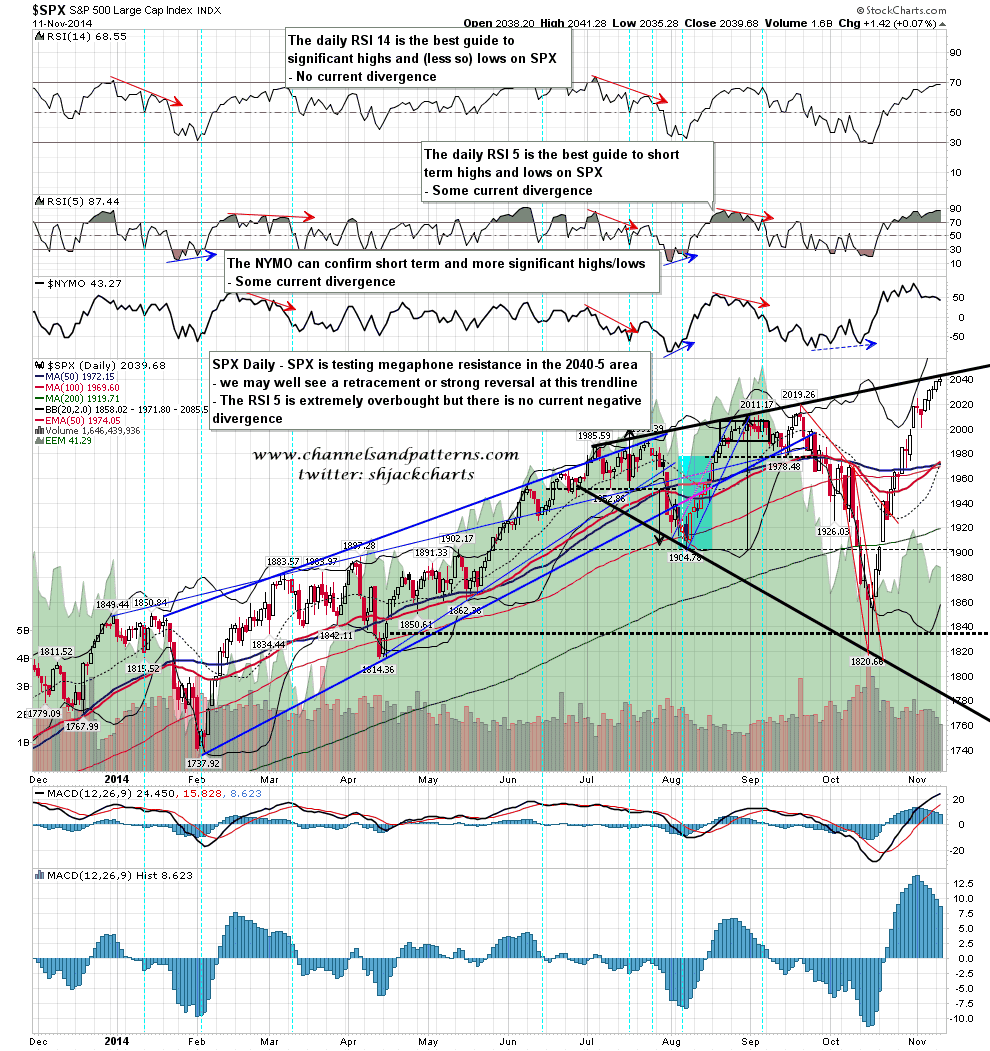
SPX hit my 1940-5 target range yesterday and at the moment seems to be failing there. That fail looks very bearish but I’ll be assuming that this is a retracement only unless we break through the MA support cluster in the 1970-80 area to open up a possible retest of the 200 DMA at 1920, and then break hard through that on that retest. Until then I will be assuming that we are looking for a retracement before a move to new highs. SPX daily chart:
Slope of Hope Blog Posts
Slope initially began as a blog, so this is where most of the website’s content resides. Here we have tens of thousands of posts dating back over a decade. These are listed in reverse chronological order. Click on any category icon below to see posts tagged with that particular subject, or click on a word in the category cloud on the right side of the screen for more specific choices.
Trendline Support Breaks
I was looking at two important trendline support levels on Friday morning, and both of them broke down in the afternoon. The pattern from the 2001 low has fixed as a rising wedge and that should now be in a short term topping process. SPX 1min chart:

A Quartet to Ponder
The past few days have been quite an emotional and price roller coaster. I’ve got one of my “deep thinking” posts tumbling around in my head that some people really like; whether or not I actually write it remains to be seen. So I’ll just do a low-thinking chart post.
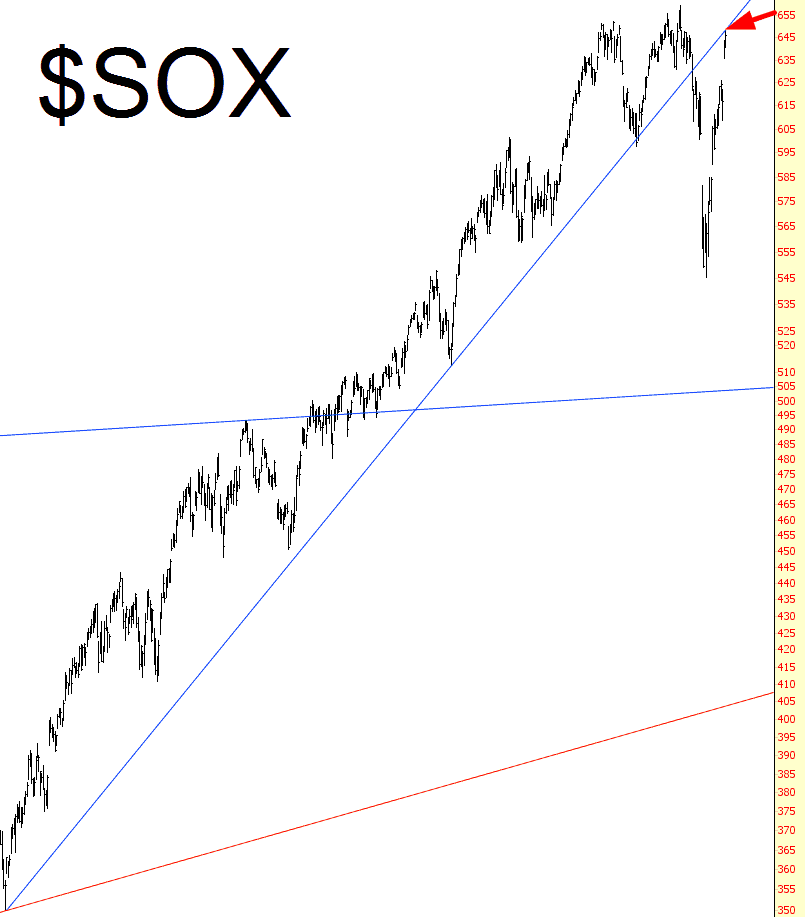
One nifty way to look at where the big bounce has put us is the semiconductor index, which has been an important guide to market strength and weakness. It’s perfectly nailing the underside of its trendline, which is serving its role as resistance. This is a likely turning point.
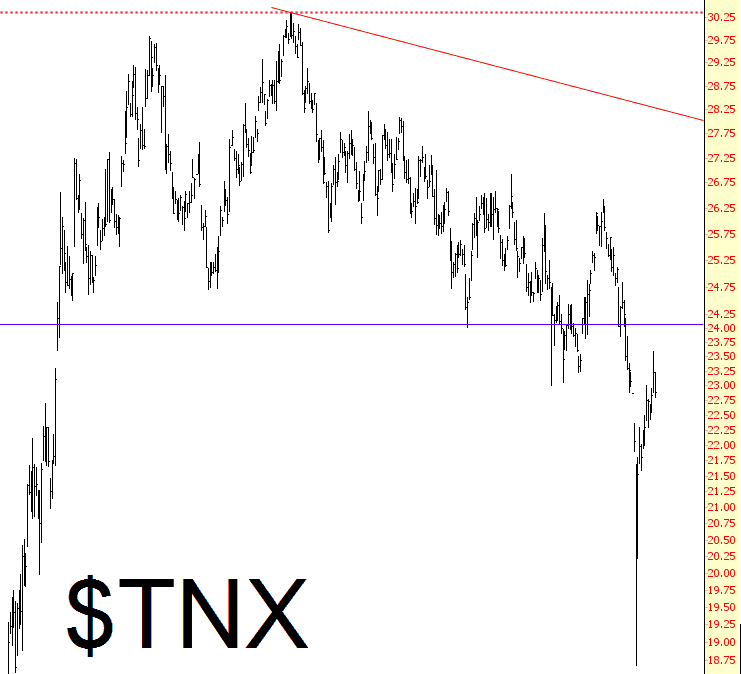
Interest Rates
Interest rates utterly collapsed at the equity market’s bottom on October 15th, and they have soared since then (as have, obviously, stocks). We are nearly a monstrous overhang at this point, however, and my view is that rates will resume their downward fall soon (with bonds, naturally, strengthening the whole while).