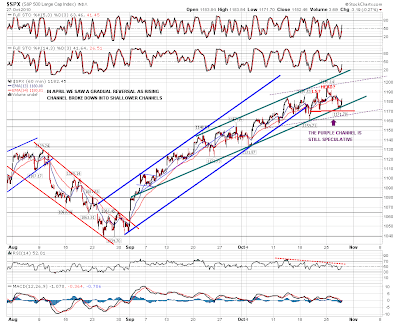
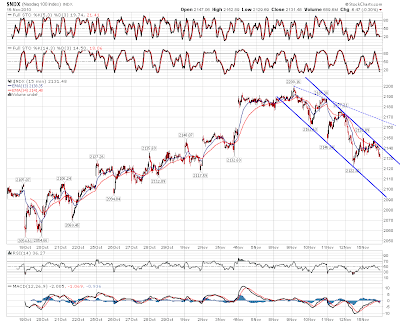
There's not much to say on equities today. Obviously SPX is still in a declining channel, and the next downside target is in the 1184 – 1186 area, depending when we hit it today. There is obviously a chance that won't be hit, but support at 1195 SPX broke overnight, and I think a downside trendline hit is now more than likely. After that hit the upside target will be in the 1200 – 1202 SPX area, and a break up from the declining channel will signal that this retracement may well be over, though if this has just been the A wave of an ABC retracement, then there may be more downside coming after a bounce. Here it is on the SPX 15min chart:

The declining channel on the Nasdaq isn't as pretty, but looks just as playable, and the downside target is slightly under 2100 today:
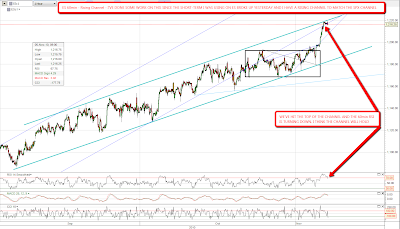
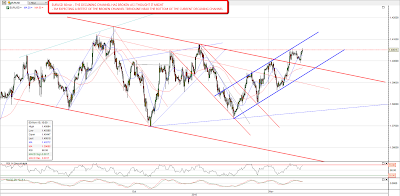
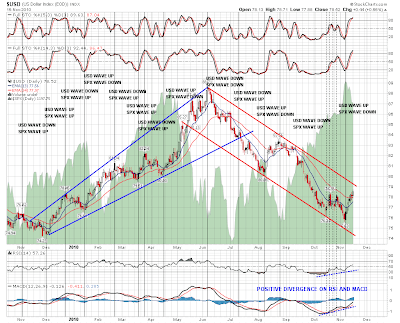
In terms of USD, which is the driver of so much of what we see on equities in these days of devaluation and runaway monetary inflation, we have almost reached the top of the declining channel on the daily chart, which I have at slightly over 79. Obviously once we reach it we then see whether the declining channel holds, and USD resumes its plunge into oblivion, or the declining channel breaks, and we see a bounce back to the weekly triangle target in the mid-80s. That could still go either way think. Obviously the Fed is determined to devalue USD, and they are in a position to deliver that, but equally the trading partners (and creditors) of the US are not happy to let them do that, and we don't know yet how that disagreement is going to play out. Here's the declining channel on the USD daily chart:
One thing that has been comical to watch over the last three years has been the flight to safety trade, where whenever equities have fallen, we have seen a flight to areas of perceived relative safety notably, and amusingly, to US treasuries and the Yen. That's amusing, as a flight to safety, because it has seemed increasingly unlikely over this period that the US will ever be able to repay its debts, and Japan, several years ahead in this respect, is already insolvent on any reasonable basis, with a debt in terms of GDP per head that is 50% higher than in Greece.
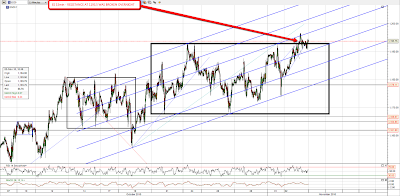
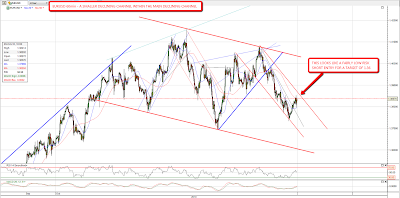
For whatever reason, and we should definitely consider the possibility that it is because there is now no perceived risk of a major decline in equities in the near future, the flight to safety trade has collapsed on this current equities retracement. Yen is retracing from close to an all time high. On the USDJPY chart that is reversed of course, so that's playing out as a bounce from support with the obvious target being 86 to finish the head on an IHS. Here it is on a 17 year weekly chart:
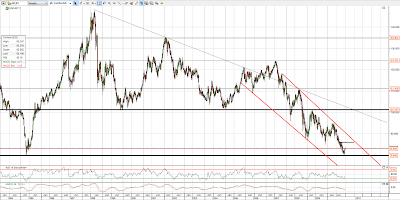
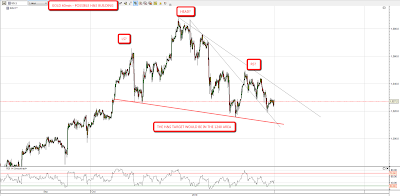
On US treasuries the start of QE2 is having a similar effect to the one we saw at the start of QE1, with a major fall in bonds and spike in long term US interest rates. So far these have spiked from 3.5% in the summer to almost 4.4%. The obvious long term resistance trendline is at 4.7% and they may well reverse there, though there is a very real possibility that the thirty year bull market in bonds ended in late 2008, and that interest rates will break resistance and go much higher. Here's the 20 year monthly $TYX chart for 30 year T-Bond Yields to show what I mean:

The bond chart is possibly the most important longer term chart to watch nowadays, as for all its impressive power to print money, unless the Fed is happy to mop up all demand for treasuries just by printing money, it still needs to maintain confidence in bondholders that they will get their money back. That is complicated by the fact that many US treasuries are held overseas and that the Fed must keep yields and thereby interest rates low in order to protect the US economy from an interest rate shock. If $5 trillion of US treasuries is held by foreigners, and that appears to be about right, then a 10% devaluation in USD is effectively a $500bn windfall tax on foreigners holding US treasuries that yield a small fraction of that. Small wonder that enthusiasm for USD devaluation is very limited outside the US.