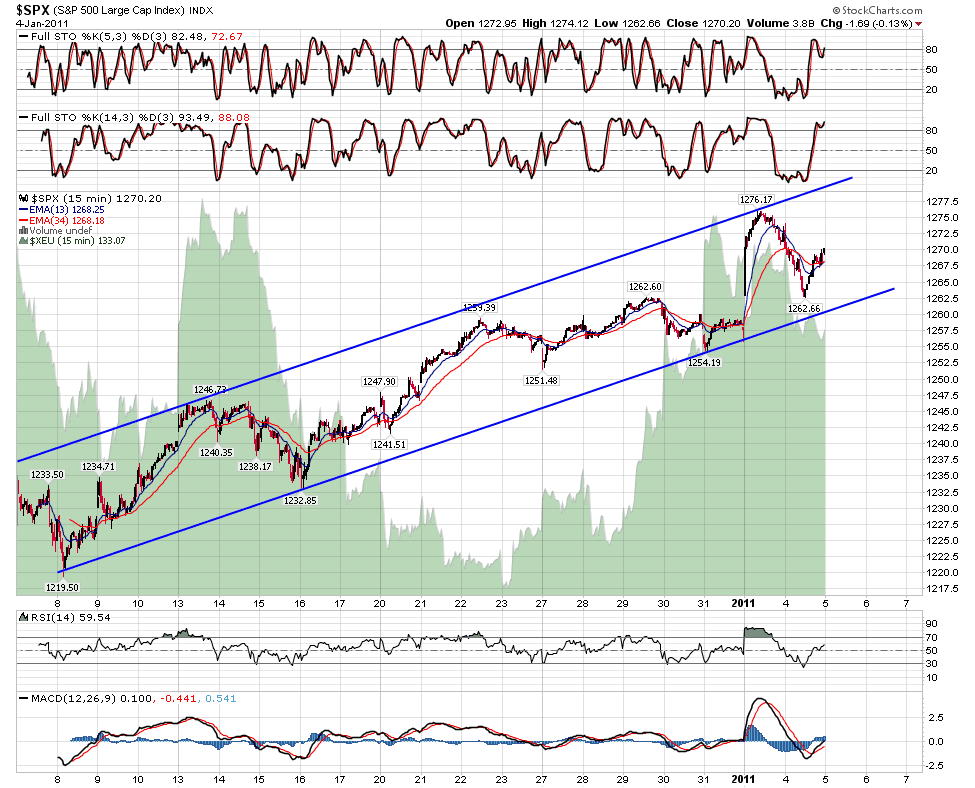
I've been away for a few days and on my return things are starting to look a bit more interesting on the bear side. I'm not really expecting to see a significant top before February, but there are some serious signs of weakness appearing now and we could top earlier. The key thing on SPX short term is to see whether the rising channel for the last month can be broken. That's best seen on the SPX 15min chart and I'm expecting to see at least a hit of the lower channel trendline today:
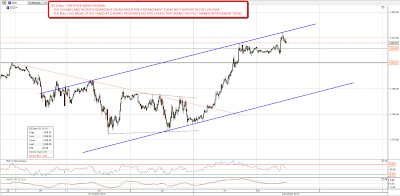
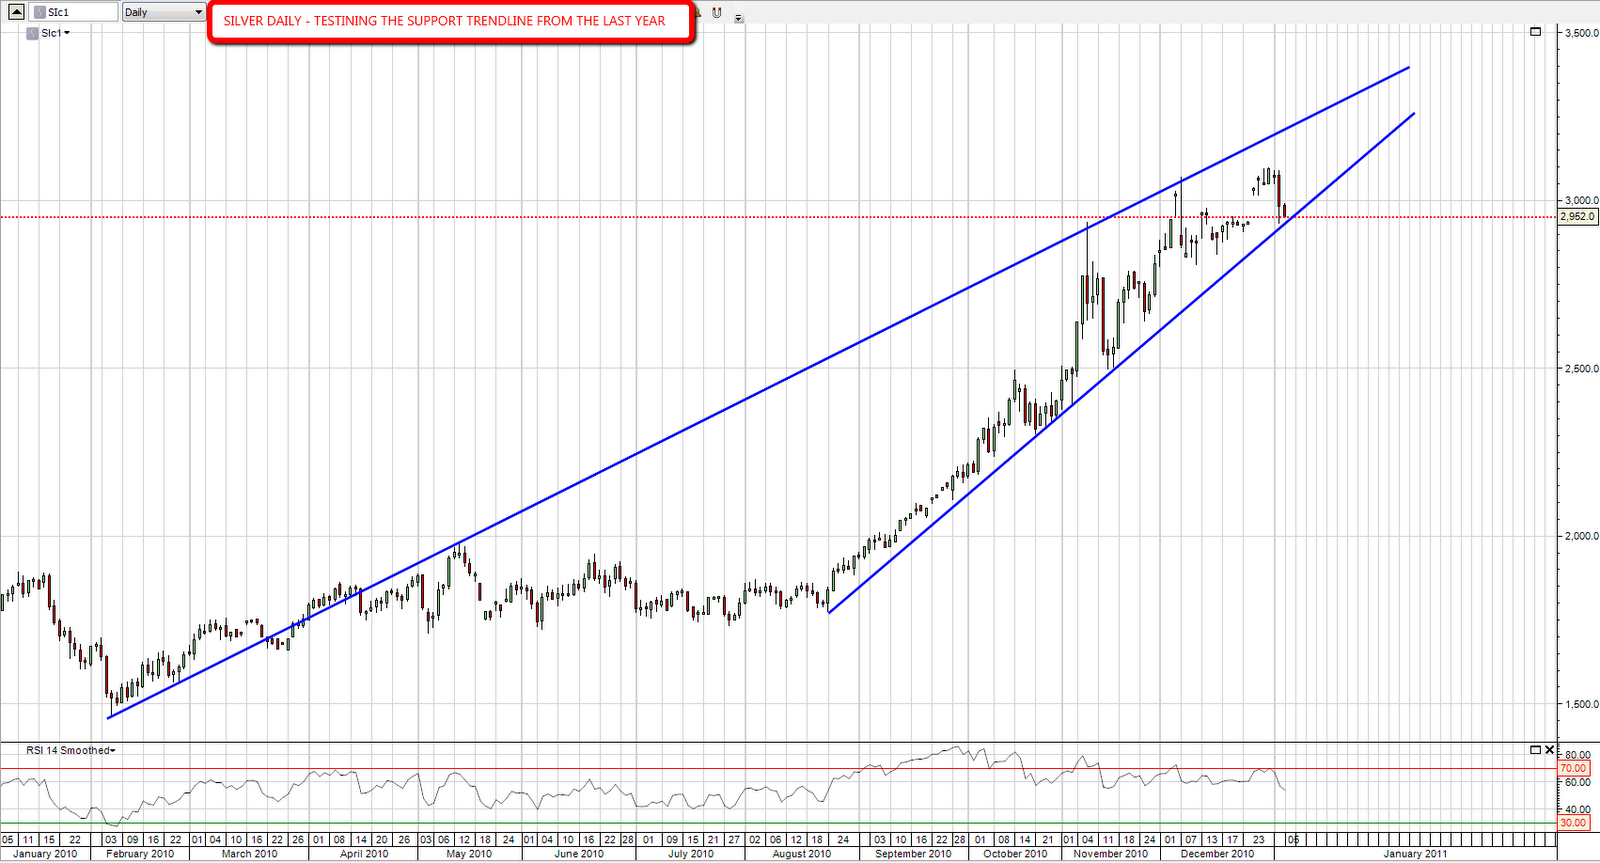
The spike in silver last week left me feeling bullish on equities short term then so it's very interesting to see that silver is now showing real signs of weakness. Silver tested the support trendline from $18 yesterday and I think that there is a very real chance that it will break. Silver has hit the obvious long term resistance trendline now and a break of shorter term support here should signal a serious correction. Here's the one year view:
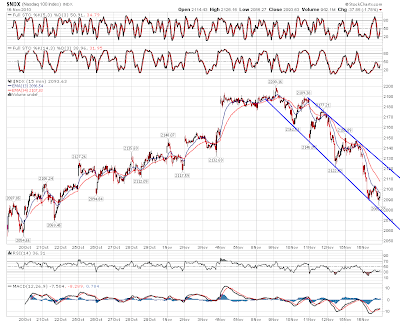
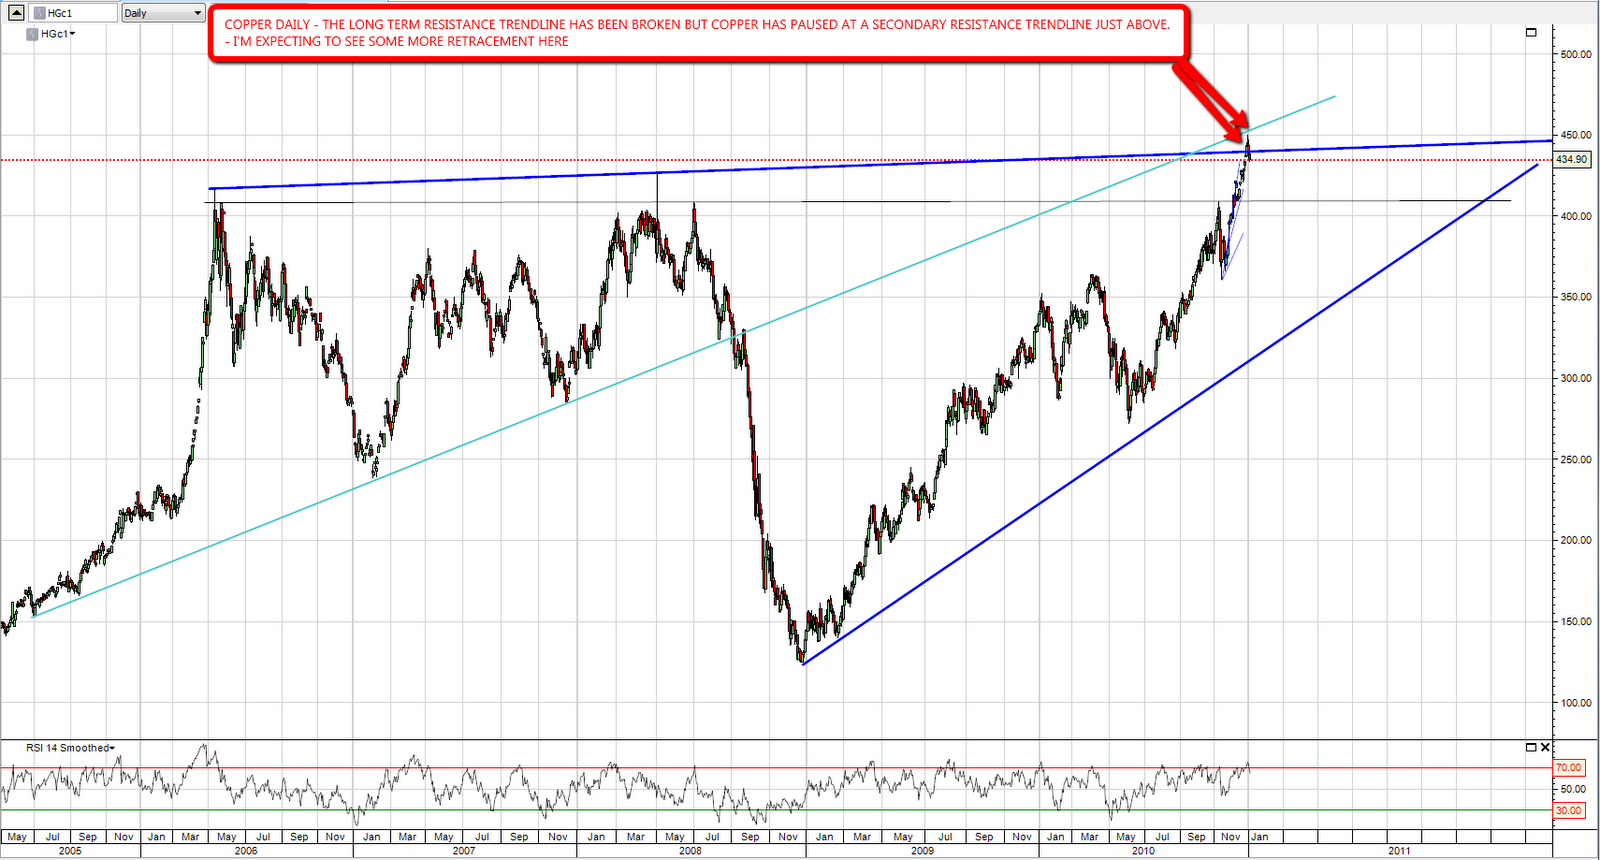
I was very disappointed to see copper break up through long term resistance last week but shorter term resistance slightly above has held and copper may well also have made a significant interim top:
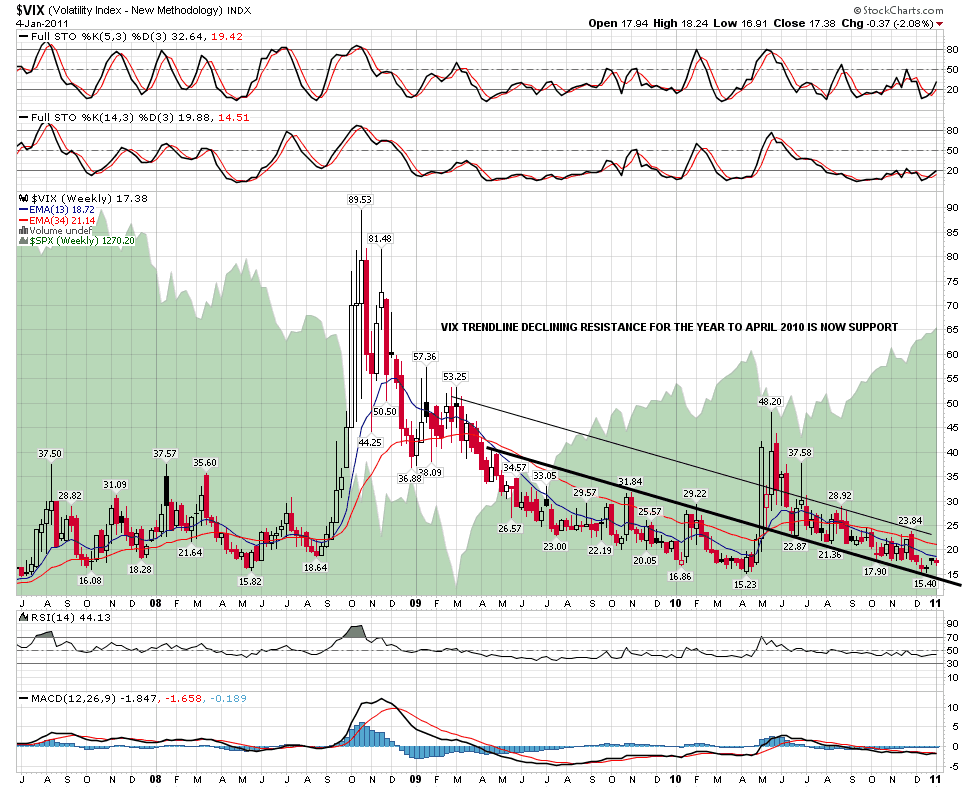
I posted the Vix weekly chart a couple of times in December to show the key support trendline being hit. Vix has bounced a bit since then and I'm not expecting to see that support trendline broken anytime soon:
I also posted the TLT falling wedge in December. As I expected, the upper trendline of the wedge was hit and we've seen a nice reversal from there. I'm in two minds about where TLT goes from here though. A move to the lower trendline of the wedge would require a major break of long term resistance on bond yields, which would in my view confirm that the thirty year bull market in bonds has finished. I'd like to see that but it may well be that the TLT falling wedge will break instead, which would then be a decent long entry if that happens:

I'm expecting to see a topping process start in earnest soon and it looks as though it may well have started already. I'm leaning short today and I think we could see significant further weakness this week. Regardless I'm not now expecting to see a lot more upside on equities before the next major interim top is made.