
Slope of Hope Blog Posts
Slope initially began as a blog, so this is where most of the website’s content resides. Here we have tens of thousands of posts dating back over a decade. These are listed in reverse chronological order. Click on any category icon below to see posts tagged with that particular subject, or click on a word in the category cloud on the right side of the screen for more specific choices.
Market Review Video
That Index Shine
It’s been extraordinary rough sailing for the rapidly diminishing equity bears on the planet since April 7th. In retrospect, the entire Trade War Bear Market lasted two days and one minute. That is to say, it spanned Thursday, April 3, Friday, April 4, and for the first minute of Monday, April 7th. That was it. A grand total of thirteen hours and one minute of a bear market. Whoop-de-freakin’ do!
Having said that, let’s catch up with a handful of key markets. First up is the NASDAQ 100, which is getting within spitting distance of its lifetime high (set in February) but remains beneath its broken trendline. A push above this broken trendline would be simultaneous with a lifetime high and would probably end all bearish ambitions for months to come.

A Modest Proposal
In my last post on Sunday 1st June I was looking at the bullish leaning stats for yesterday and today and that’s been delivering. I was leaning towards seeing a retest of the May highs on ES and NQ at 6008 and 21858 respectively and we may still see those today but ……. there is another possibility that I’m considering if those highs aren’t retested today.
Of the next six days four of them lean significantly bearish historically and there is a window there for some more consolidation and possible retracement and, while these stats are just a loose guideline, I am wondering if we might see that. We’ll see. I would note though that the window closes after that, with the subsequent three days all leaning bullish.
That’s not what this post is about though. I’ve been talking all year about seeing weakness in the first half of the year and then new all-time highs in the second half of the year, and while the initial weakness was faster and harder than I was expecting, I am still expecting that follow through into new all-time highs, and I want to lay out my preferred as well as my most bullish scenario for seeing that over coming weeks.
(more…)A Different Breadth View
The ETF symbol SPY is the granddaddy of them all. It’s the oldest, most heavily-traded, and best-known. There is a very similar fund, however, with the symbol RSP, which also represents the S&P 500. Its difference, however, is that its calculation is based on the equal-weighted S&P 500, as opposed to the “normal” S&P which heavily favors the mega-caps.
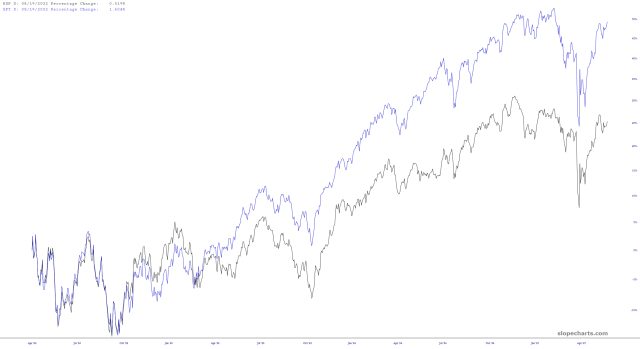
As shown in the chart above, the SPY (blue line) has massively outperformed the RSP (black line) over the past couple of years. This simple difference in weighting yields about a two-fold difference in performance, because the mega-caps are carrying so much weight.
