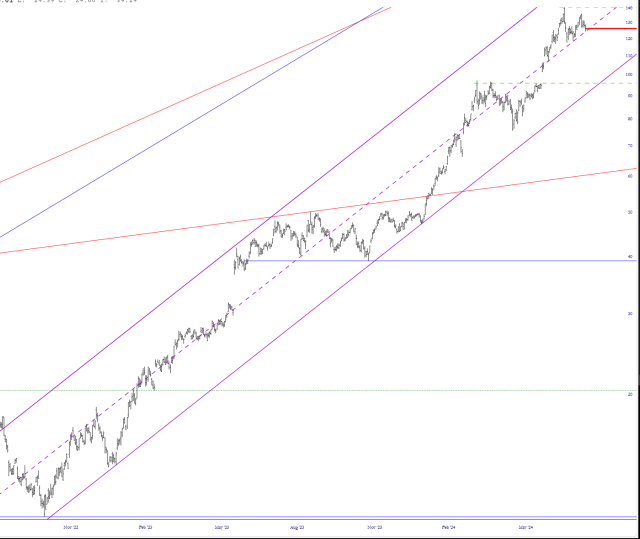
For 22 months (!), NVDA has politely traveled within the tidy confines of an ascending price channel.
Slope initially began as a blog, so this is where most of the website’s content resides. Here we have tens of thousands of posts dating back over a decade. These are listed in reverse chronological order. Click on any category icon below to see posts tagged with that particular subject, or click on a word in the category cloud on the right side of the screen for more specific choices.
For 22 months (!), NVDA has politely traveled within the tidy confines of an ascending price channel.
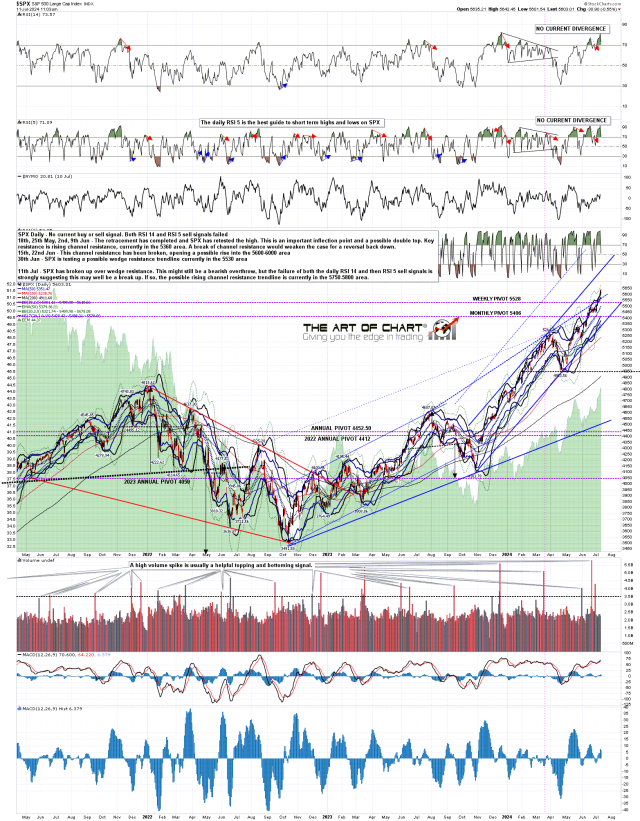
Last week I was looking at the decent looking resistance trendlines and growing mass of negative RSI divergence on both SPX and NDX. Over the course of the last week first the SPX resistance trendline broke, though this could still be a bearish overthrow, and then the daily RSI 14 sell signal failed on Friday, and then the SPX RSI 5 sell signal failed yesterday. That is very unusual and does not favor a significant high being made here.
SPX daily chart:
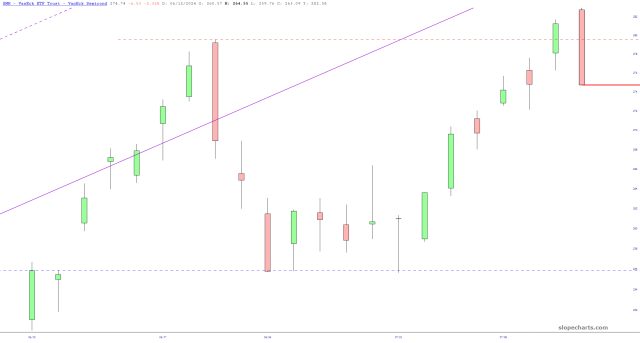
Any chart I post today is going to be outdated, because the market is moving so fast – – but as of this composition, the semiconductor index ETF (symbol SMH) opened at its highest point in history and then proceeded to fail its bullish breaking and create a gargantuan Bearish Engulfing Pattern. Maybe this is finally the end of this nonsense.
The market has been making lifetime highs pretty much every day since mid-April, which makes it a bit of a challenge to write about. It’s sort of like being a weatherman in a place where it’s always clear and 72 degrees. We can see a more-or-less saucer pattern completing in every time scale imaginable, whether minute bars……..
See the dashed purple line? Break it, and the entire tone of the market will change. Everyone knows the market is insanely overvalued. They’re just accustomed to it becoming even more overvalued, so it’s a multi-trillion dollar game of musical chairs. My bet is that the music is about to stop.

