
Last week I was looking at the decent looking resistance trendlines and growing mass of negative RSI divergence on both SPX and NDX. Over the course of the last week first the SPX resistance trendline broke, though this could still be a bearish overthrow, and then the daily RSI 14 sell signal failed on Friday, and then the SPX RSI 5 sell signal failed yesterday. That is very unusual and does not favor a significant high being made here.
SPX daily chart:
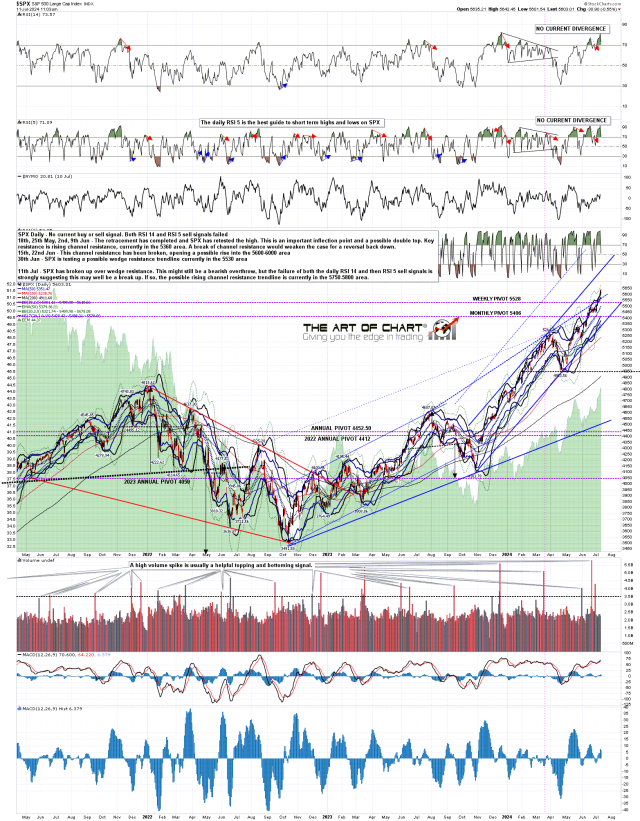
If this is a break up rather than just a bearish overthrow, then the next obvious target would be rising channel resistance, currently in the 5750 to 5800 area. There is still an open hourly RSI 14 sell signal that didn’t quite fail yesterday, suggesting that the move down from the overnight high may well have further to go.
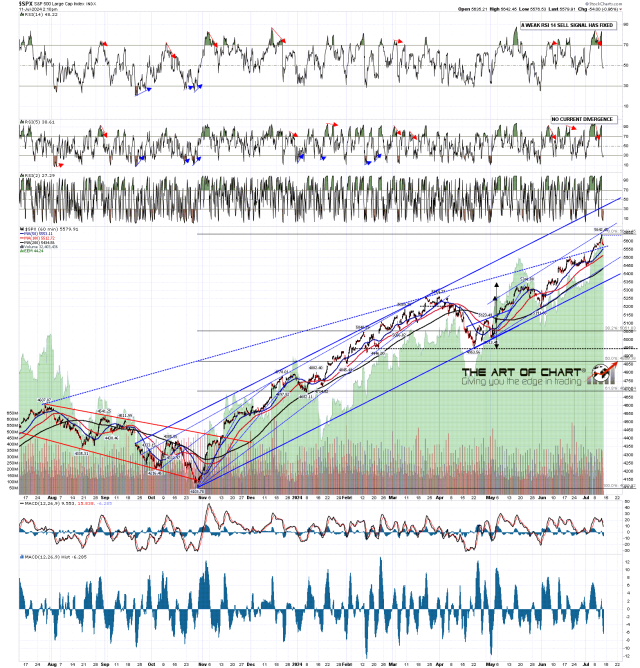
SPX hourly chart:
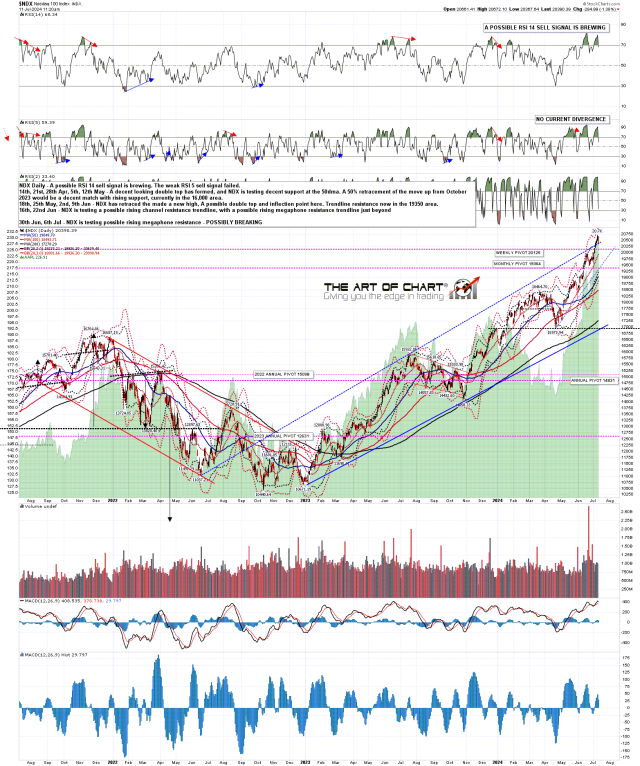
If we are seeing a break up on the NDX chart then there is no obvious next resistance trendline. There is still a possible daily RSI 14 sell signal brewing and if this retracement from the overnight high follows through, then that may fix tomorrow.
NDX daily chart:
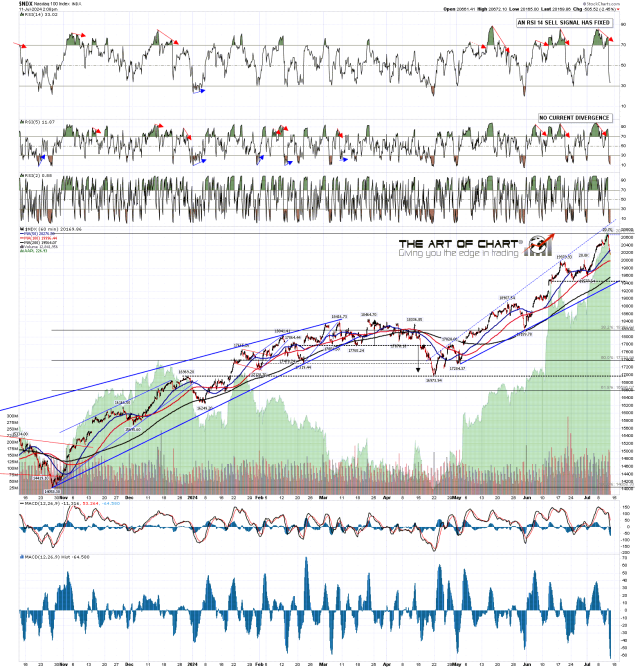
On the hourly chart the RSI 14 sell signal has reached the possible near miss target. I would start getting seriously interested in the downside only if NDX could get back to a test of the possible H&S neckline in the 19577 area.
NDX hourly chart:
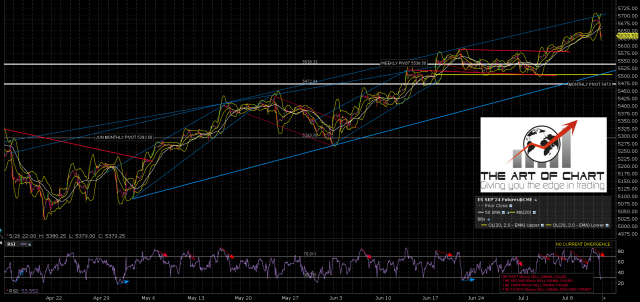
Until then, I’d like to show the ES Sept hourly chart for the last three months and draw your attention to the three failed hourly sell signals over the last week until the fourth finally fixed and made target this morning. This was very unusual, and I think I can recall this happening one other time since the 2009 low, maybe in 2013. It is a sign of a very strong trend, the kind that can keep running up or down through resistance levels and divergences until it has played out. This is the kind of thing you might see on a chart once a decade or so.
When the current retracement ends, that collapse upwards may resume, and both NDX and SPX could run a lot higher until that fails.
Hence the title, in LOTR, when Gandalf stands on the bridge and tells the Balrog that he shall not pass, it doesn’t end well for him. A really strong trend is not a great time to be doing that either. That strong trending move may have just ended of course, but if it hasn’t then discretion in shorting this market would likely be the better part of valor. Once that trend ends, then normal trading can resume.
ES Sep hourly chart:
We are doing our free monthly Chart chat on Sunday 14th July at 4pm Eastern Time, covering the usual very wide range of trading instruments. If you’d like to attend you can register for that here.
