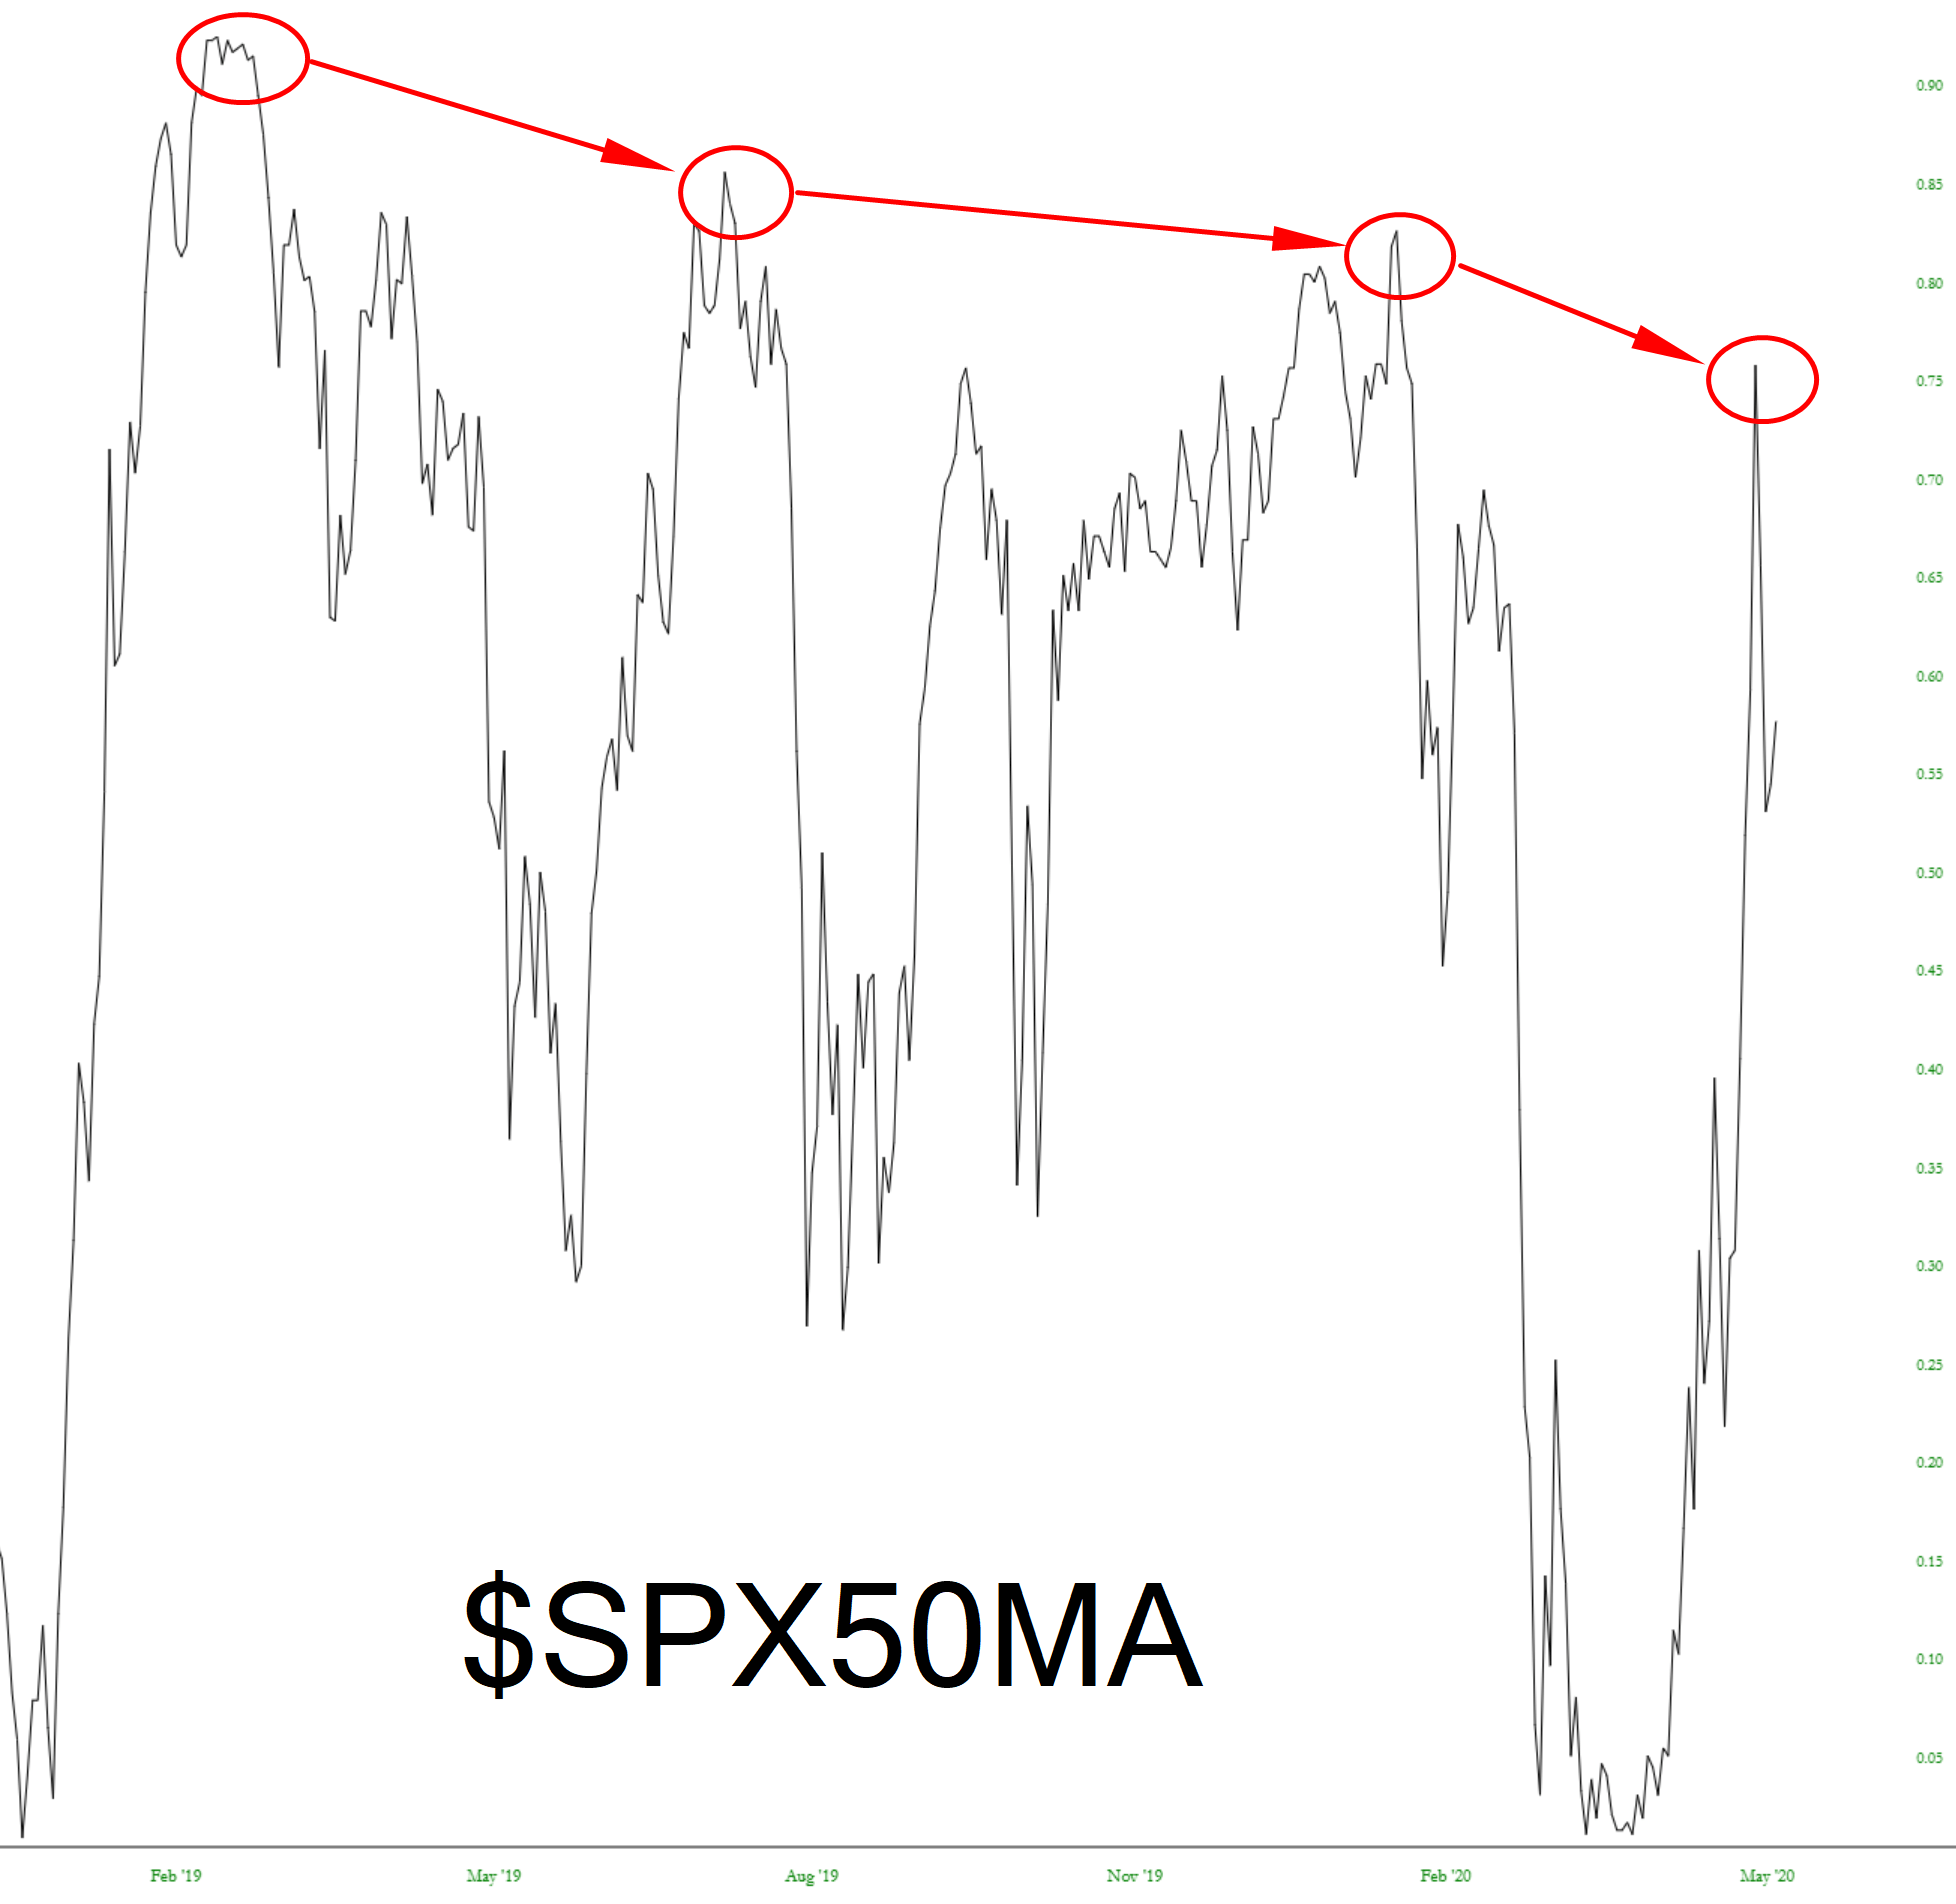
It’s said a picture is worth a thousand words. This one qualifies.
Slope initially began as a blog, so this is where most of the website’s content resides. Here we have tens of thousands of posts dating back over a decade. These are listed in reverse chronological order. Click on any category icon below to see posts tagged with that particular subject, or click on a word in the category cloud on the right side of the screen for more specific choices.
I’ve got an exciting improvement to announce with the Seismograph mode in SlopeCharts. This feature is available to all paying members.
We introduced this feature a month ago, and as cool as it was, it could only show Daily data. We have completely enhanced it so that you can see non-intraday granularities, including yearly………
We have an extremely important, and long-requested, improvement in SlopeCharts to announce. This has to do with technical studies: specifically, the moving averages.
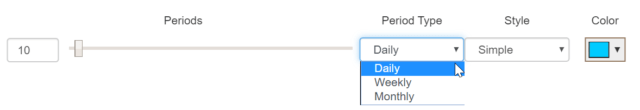
We recently expanded our moving averages to four kinds – Simple, Exponential, Weighted, and Hull. Now we have taken things a step further by introducing three levels of granularity – Daily, Weekly, and Monthly (whereas before you had no choice but Daily).
You can establish these parameters when you set up any moving average study.
A while ago, we introduced our Statistics data panel. An important part of that panel was the Advances/Declines data, but we had to get rid of it because the data vendor stopped providing it. Undaunted, we decided to create the data ourselves! So I’m delighted to let you know the Statistics data panel is back, and frankly I think the data is better than ever (since we created it this time).
The Slope of Hope system calculates each day the number of stocks that increased in value, the number that decreased in value, what the sum total of those values is, and what the “running” total is back to the beginning of its calculation, many years ago.
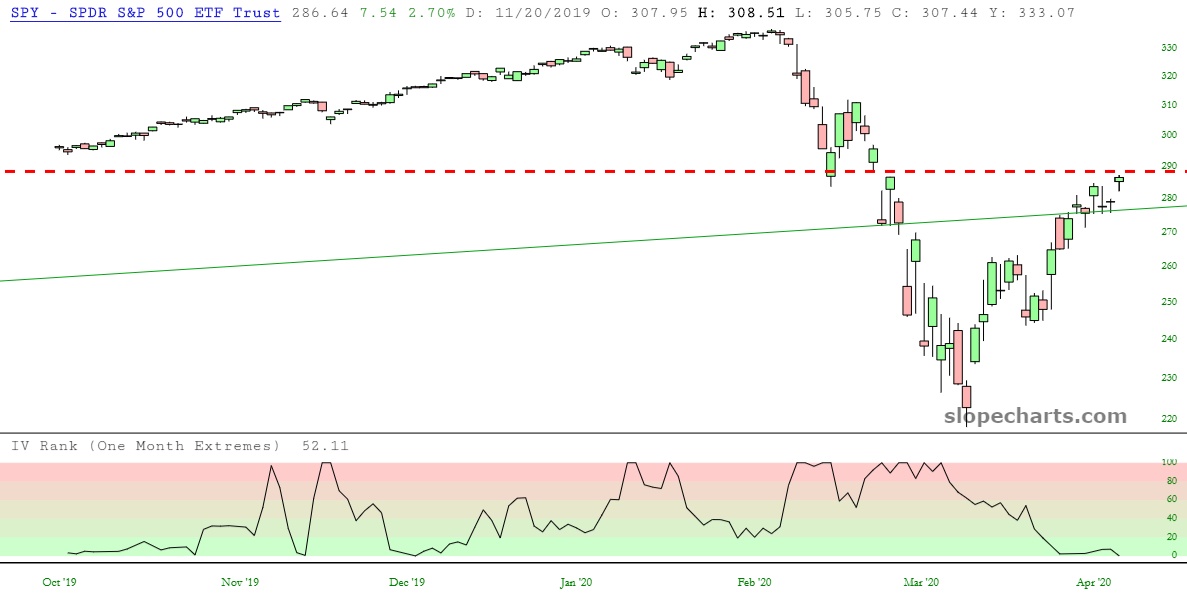
(more…)I found this kind of fascinating. Here is the SPY shown with its 30-day IV rank. This relative rank of volatility went roaring higher late in February, and it kept banging up around the 100 level for the first half of March. Naturally, since then, it has plunged back down to nearly 0, since Powell is Large and In Charge.